
- LIVE QUOTES
- LEARN
- HELP
 Nasdaq
 Wall Street Journal
EN
Has the Market Priced In Arlo Technologies’ 331% Three Year Surge?
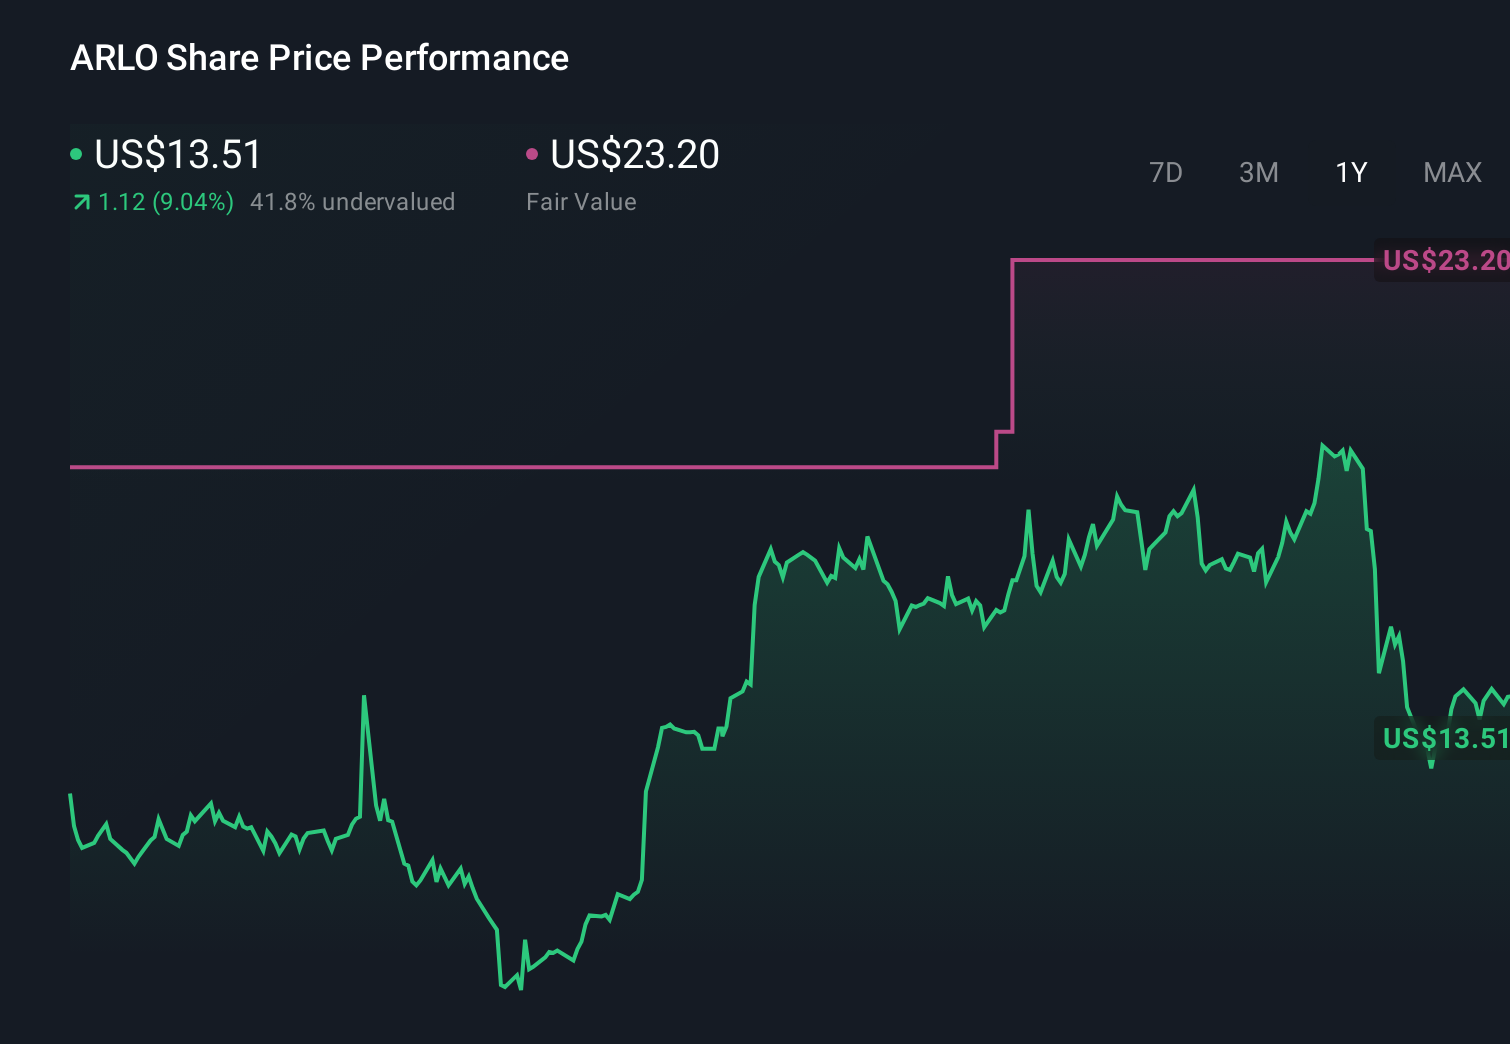
- Wondering if Arlo Technologies at around $14 is still a smart buy, or if most of the upside has already been priced in? You are not alone in asking whether the current tag matches the real value of the business.
- The stock is up 0.6% over the last week, down 8.9% over the past month, but still up 30.9% year to date and 331.2% over 3 years. This mix hints at both strong long term momentum and shifting risk perceptions in the short term.
- Those swings have come as Arlo continues to refine its smart home security ecosystem and expand subscription services, which the market tends to reward when it sees durable, recurring revenue. Recent product enhancements and ongoing platform upgrades have kept investors focused on whether Arlo can turn its installed base into a more profitable, sticky business.
- Right now Arlo scores a 3 out of 6 on our valuation checks, suggesting pockets of undervaluation but also some areas where the price looks more fully valued. Next we will walk through the key valuation approaches before circling back to a more powerful way to think about what the stock is really worth over time.
Find out why Arlo Technologies's 9.1% return over the last year is lagging behind its peers.
Approach 1: Arlo Technologies Discounted Cash Flow (DCF) Analysis
A Discounted Cash Flow, or DCF, model estimates what a company is worth by projecting the cash it could generate in the future and then discounting those cash flows back to today in dollar terms. For Arlo Technologies, the model used is a 2 Stage Free Cash Flow to Equity approach.
Arlo currently generates about $60 million in Free Cash Flow, and analysts plus extrapolated estimates see this rising steadily over time. By 2035, projected Free Cash Flow is expected to reach roughly $125.5 million, with growth rates gradually slowing from high teens to low single digits, which is typical as a business matures.
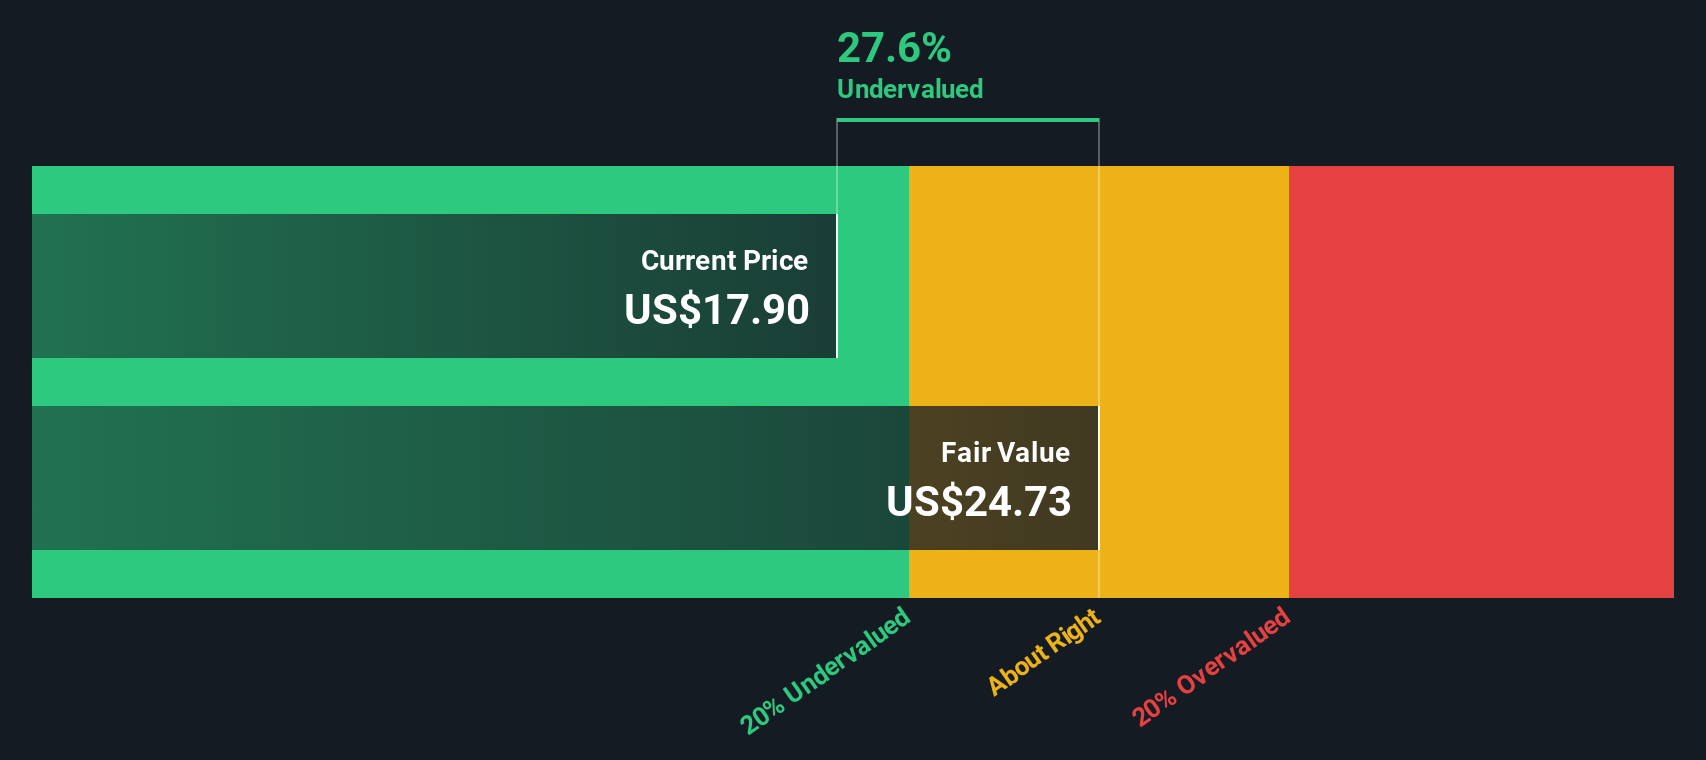
When all these future cash flows are discounted back, the model arrives at an intrinsic value of about $16.61 per share. With the stock trading around $14, the DCF implies roughly a 13.5% discount, suggesting the shares are modestly undervalued rather than priced for perfection.
Result: UNDERVALUED
Our Discounted Cash Flow (DCF) analysis suggests Arlo Technologies is undervalued by 13.5%. Track this in your watchlist or portfolio, or discover 908 more undervalued stocks based on cash flows.
Approach 2: Arlo Technologies Price vs Sales
For companies like Arlo that are still scaling profitability but already generating meaningful revenue, the Price to Sales (P S) multiple is often the cleanest way to compare valuation. Investors typically accept a higher P S for businesses with stronger growth prospects and lower risk, while slower or riskier names tend to trade at a discount.
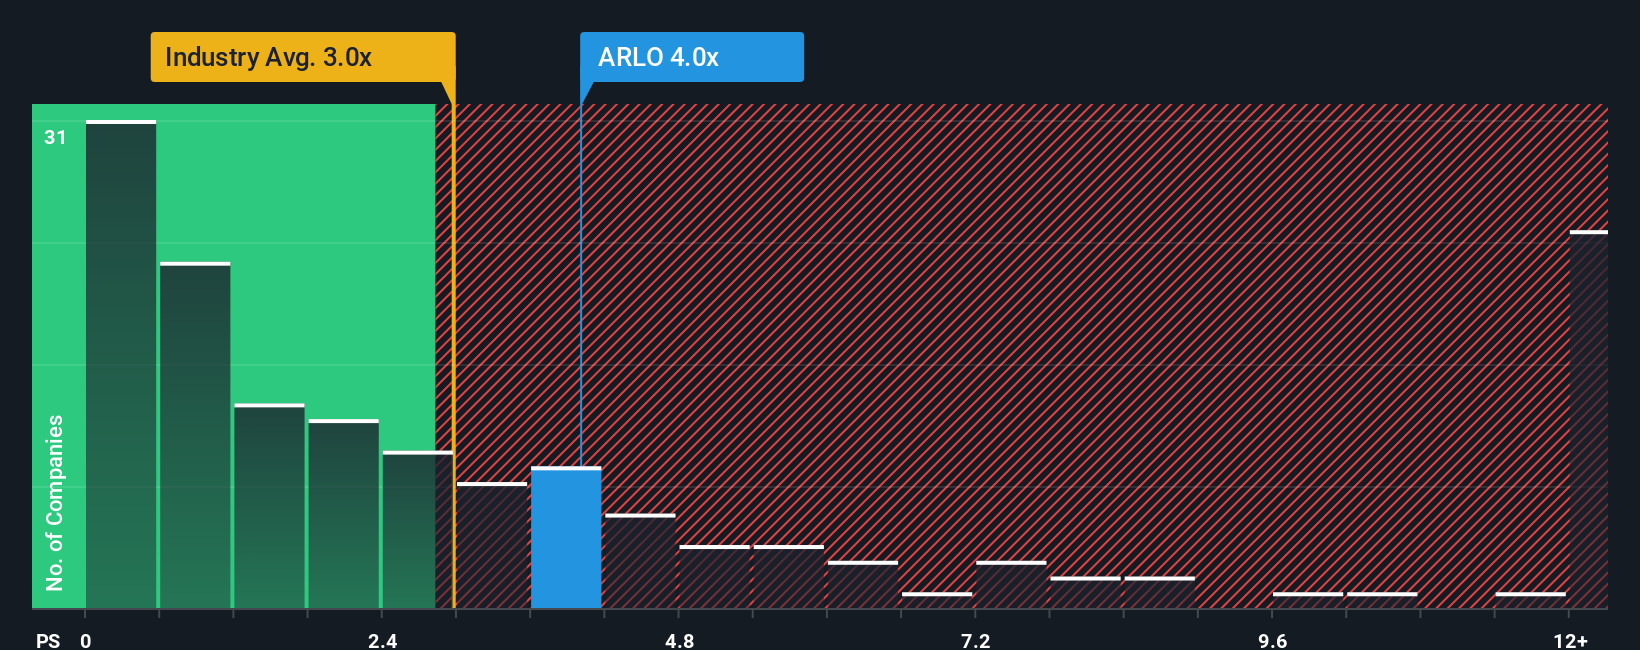
Arlo currently trades on a P S of about 3.0x. That is slightly above the broader Electronic industry average of roughly 2.5x, but below the peer group average of around 5.0x. This suggests the market is recognizing Arlo’s growth potential without assigning it a top tier premium. Simply Wall St’s proprietary Fair Ratio for Arlo is 2.0x, which estimates what a reasonable P S should be once you factor in its revenue growth outlook, profit margins, risk profile, industry positioning and market cap.
This Fair Ratio is more informative than a simple peer or industry comparison because it adjusts for Arlo’s specific strengths and vulnerabilities rather than assuming one size fits all. With the current 3.0x multiple sitting notably above the 2.0x Fair Ratio, the P S lens points to the shares being somewhat ahead of fundamentals.
Result: OVERVALUED
PS ratios tell one story, but what if the real opportunity lies elsewhere? Discover 1446 companies where insiders are betting big on explosive growth.
Upgrade Your Decision Making: Choose your Arlo Technologies Narrative
Earlier we mentioned that there is an even better way to understand valuation, so let us introduce you to Narratives, a simple way to attach your own story about a company to the numbers, such as what you think its future revenue, earnings and margins will look like, and what that means for fair value. A Narrative links three things together: the business story, the financial forecast and the resulting fair value estimate, so you can clearly see why you think a stock is worth buying, holding or selling. On Simply Wall St, Narratives are available on the Community page and are used by millions of investors as an easy, accessible tool to compare a stock’s Fair Value with its current Price and decide when an opportunity or risk is emerging. Because Narratives update dynamically as new information like earnings, guidance or major news comes in, your view of Arlo Technologies can evolve in real time, whether you lean toward a more optimistic path closer to $26.00 or a cautious stance nearer $22.00.
Do you think there's more to the story for Arlo Technologies? Head over to our Community to see what others are saying!
This article by Simply Wall St is general in nature. We provide commentary based on historical data and analyst forecasts only using an unbiased methodology and our articles are not intended to be financial advice. It does not constitute a recommendation to buy or sell any stock, and does not take account of your objectives, or your financial situation. We aim to bring you long-term focused analysis driven by fundamental data. Note that our analysis may not factor in the latest price-sensitive company announcements or qualitative material. Simply Wall St has no position in any stocks mentioned.
Have feedback on this article? Concerned about the content? Get in touch with us directly. Alternatively, email editorial-team@simplywallst.com