
- LIVE QUOTES
- LEARN
- HELP
 Nasdaq
 Wall Street Journal
EN
Is It Time To Revisit Altria Group After Its Steady 2025 Share Price Climb?
- Investors wondering whether Altria Group is still a cash cow at a fair price, or if the market has quietly bid it up too far already, can use this breakdown to walk through what the numbers indicate about value, not just sentiment.
- Despite its reputation as a slow and steady dividend name, Altria's share price has inched up about 0.6% over the last week and 0.5% over the last month, adding to an 11.8% gain year to date and a 14.5% return over the past year, with even bigger gains over 3 and 5 years.
- Those moves come alongside constant debate around U.S. tobacco regulation, nicotine alternatives and how legacy cigarette volumes compare with growth in smoke free products. Investors have been weighing headlines on regulatory scrutiny, shifting consumer preferences and competitive dynamics in reduced risk products, all of which factor into how durable Altria's future cash flows might be.
- According to our checks, Altria currently scores a solid 5/6 valuation score, suggesting it screens as undervalued on most metrics, but not all. In the sections that follow, we walk through the standard valuation approaches behind that score, then finish with an additional way to think about what the stock may be worth over the long run.
Find out why Altria Group's 14.5% return over the last year is lagging behind its peers.
Approach 1: Altria Group Discounted Cash Flow (DCF) Analysis
A Discounted Cash Flow model estimates what a business is worth today by projecting the cash it can generate in the future and discounting those cash flows back to the present. For Altria Group, the 2 Stage Free Cash Flow to Equity model starts from last twelve month free cash flow of about $9.2 billion, then applies analyst forecasts for the next few years before extrapolating longer term trends.
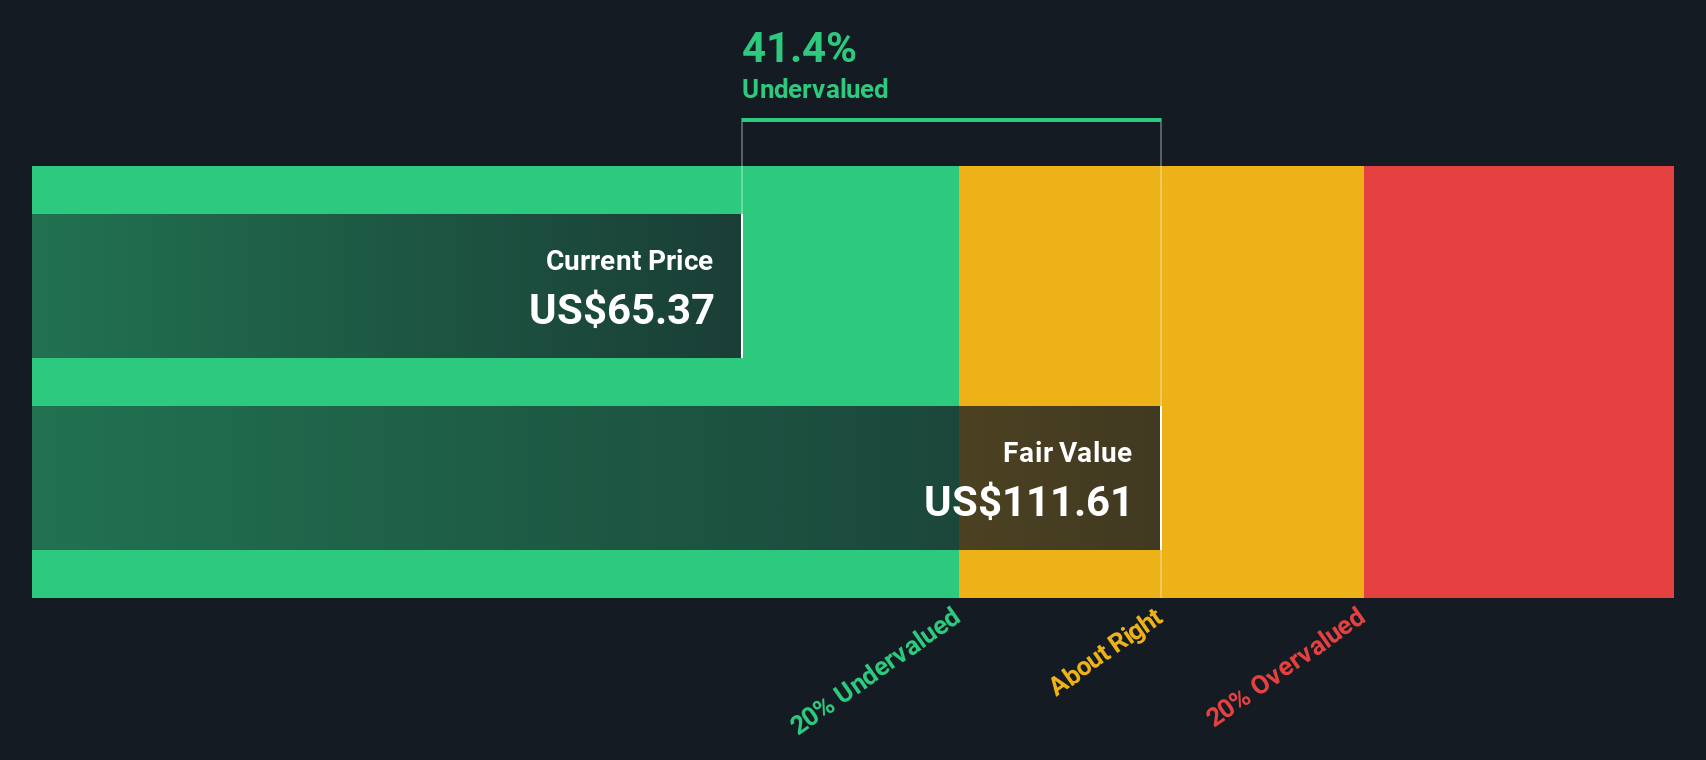
Analysts see free cash flow remaining close to current levels near term, with projections such as $8.6 billion in 2026 and $9.1 billion in 2027. Beyond that, Simply Wall St extends the forecasts using modest growth assumptions, reaching an estimated free cash flow of roughly $10.8 billion by 2035. Discounting this stream of future cash flows back to today yields an intrinsic value estimate of about $104.49 per share.
That DCF value implies the shares trade at roughly a 43.8% discount to estimated fair value. This indicates the market is pricing Altria well below its modeled cash generation capacity.
Result: UNDERVALUED
Our Discounted Cash Flow (DCF) analysis suggests Altria Group is undervalued by 43.8%. Track this in your watchlist or portfolio, or discover 908 more undervalued stocks based on cash flows.
Approach 2: Altria Group Price vs Earnings
For a mature, consistently profitable business like Altria Group, the price to earnings (PE) ratio is a straightforward way to gauge how much investors are paying for each dollar of earnings. In general, companies with stronger growth prospects and lower perceived risk tend to command higher PE multiples, while slower growth or higher risk usually correspond to a lower, more conservative PE.
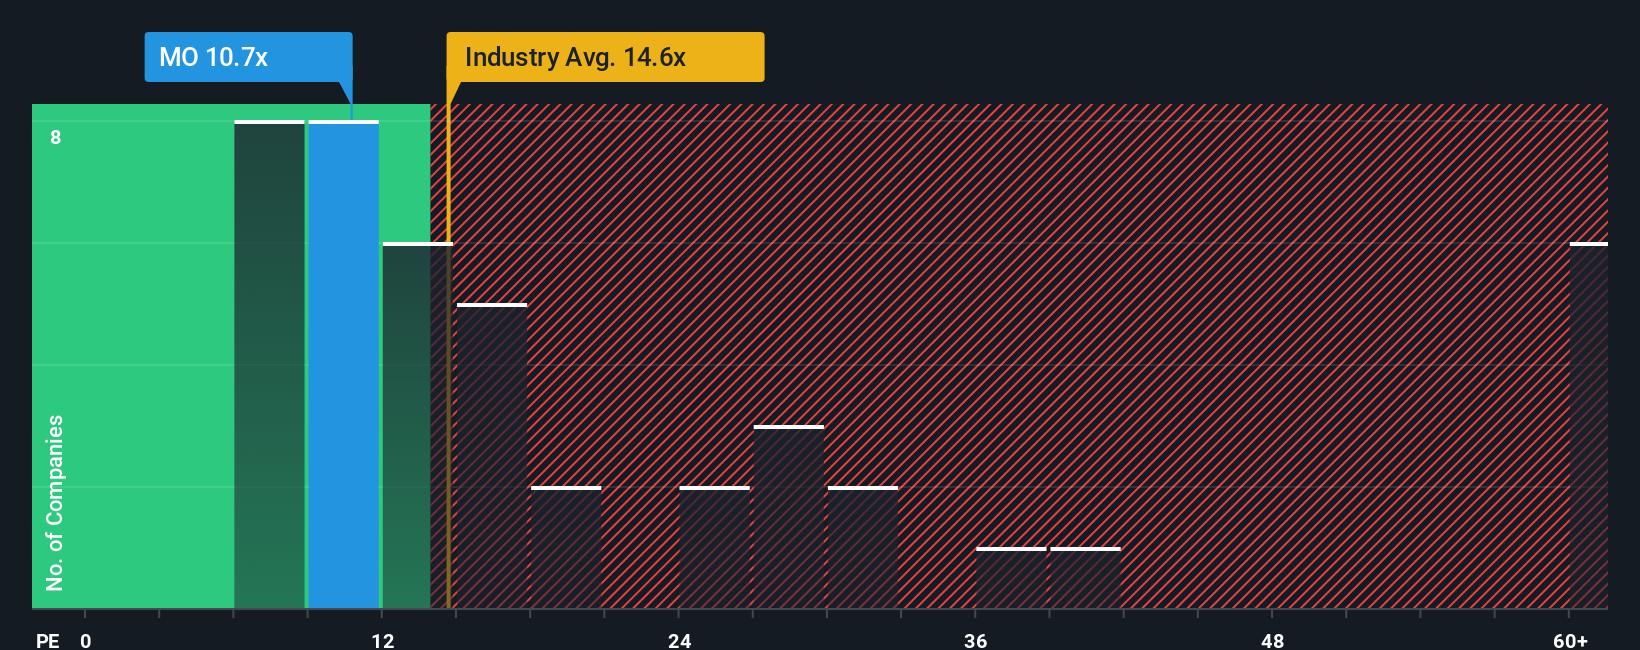
Altria currently trades on a PE of about 11.1x, which is below both the Tobacco industry average of roughly 13.5x and the broader peer group average near 20.9x. Simply Wall St also calculates a Fair Ratio of around 19.1x, which represents the PE Altria might reasonably trade at given its earnings growth profile, industry positioning, profit margins, size and risk factors.
This Fair Ratio is more tailored than a simple comparison to peers or the industry because it adjusts for company specific characteristics rather than assuming all tobacco names warrant the same multiple. With Altria trading at 11.1x versus a Fair Ratio of 19.1x, the stock currently appears meaningfully undervalued on an earnings basis.
Result: UNDERVALUED
PE ratios tell one story, but what if the real opportunity lies elsewhere? Discover 1446 companies where insiders are betting big on explosive growth.
Upgrade Your Decision Making: Choose your Altria Group Narrative
Earlier we mentioned that there is an even better way to understand valuation, so let us introduce you to Narratives, a simple framework on Simply Wall St’s Community page where you tell the story behind your numbers by linking your view of a company’s future revenue, earnings and margins to a financial forecast and a fair value. You can then compare that fair value to today’s share price to decide whether it looks like a buy or a sell, while the platform automatically updates your Narrative when new earnings, news or regulatory developments arrive. One investor might build a cautious Altria Group Narrative that bakes in flat revenue, shrinking margins and a fair value closer to the most bearish analyst target near $49. Another might construct a more optimistic Narrative based on stable pricing power, resilient margins and modest growth that supports a fair value nearer the most bullish target around $73. All of this can be done using the same tool in a way that stays dynamic, transparent and easy to adjust as the facts change.
Do you think there's more to the story for Altria Group? Head over to our Community to see what others are saying!

This article by Simply Wall St is general in nature. We provide commentary based on historical data and analyst forecasts only using an unbiased methodology and our articles are not intended to be financial advice. It does not constitute a recommendation to buy or sell any stock, and does not take account of your objectives, or your financial situation. We aim to bring you long-term focused analysis driven by fundamental data. Note that our analysis may not factor in the latest price-sensitive company announcements or qualitative material. Simply Wall St has no position in any stocks mentioned.
Have feedback on this article? Concerned about the content? Get in touch with us directly. Alternatively, email editorial-team@simplywallst.com