
- LIVE QUOTES
- LEARN
- HELP
 Nasdaq
 Wall Street Journal
EN
Should Investors Reassess Google After Its Huge 2024 Rally And AI Driven Optimism
- If you are wondering whether Alphabet is still a smart buy after its massive run, or if you are arriving late to the party, this breakdown is designed to give you a clear, valuation-first view of the stock.
- Alphabet has climbed 0.8% over the last week, 9.9% over the last month, and 69.0% year to date, adding to a 67.5% gain over the past year and more than 250% across three years. This naturally raises questions about how much upside is left versus how much optimism is already priced in.
- Recently, investors have been focused on Alphabet's ongoing push in generative AI and cloud infrastructure, as well as regulatory headlines around antitrust and digital advertising that could reshape parts of its business model. Together, these narratives help explain why the stock has been bid up so strongly while also reminding the market that Alphabet's future is not risk free.
- On our checks, Alphabet scores just 2/6 on valuation, suggesting the market may already be pricing in many of its strengths. Next, we will walk through different valuation lenses to assess whether that score is fair, and then finish with a more powerful way to think about what Alphabet is truly worth.
Alphabet scores just 2/6 on our valuation checks. See what other red flags we found in the full valuation breakdown.
Approach 1: Alphabet Discounted Cash Flow (DCF) Analysis
A Discounted Cash Flow model estimates what a business is worth by projecting the cash it can generate in the future and then discounting those cash flows back to today. For Alphabet, Simply Wall St uses a 2 stage Free Cash Flow to Equity approach built on cash flow projections.
Alphabet generated trailing twelve month free cash flow of about $92.6 billion, and analysts expect this to rise steadily, with extrapolated projections reaching roughly $254.8 billion in free cash flow by 2035. The path from around $71.3 billion in 2026 to the mid $200 billion range a decade out implies healthy but moderating growth as the company matures.
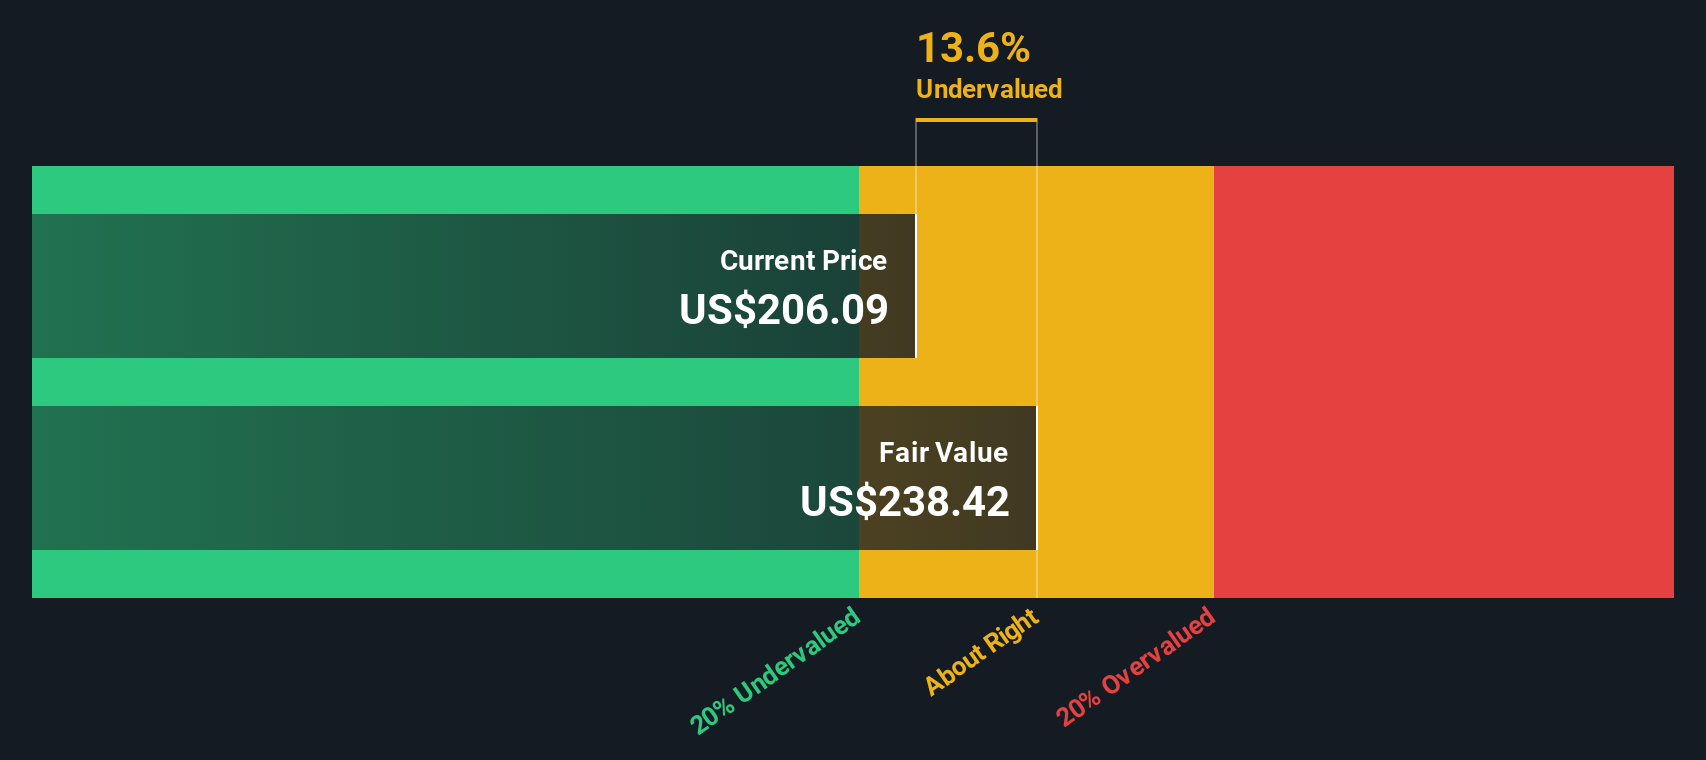
After discounting these future cash flows back to today, the model estimates an intrinsic value of roughly $288.07 per share. According to this DCF estimate, the shares trade about 11.2% above the modeled fair value, so Alphabet screens as modestly overvalued on this cash flow basis and appears neither wildly expensive nor an obvious bargain.
Result: OVERVALUED
Our Discounted Cash Flow (DCF) analysis suggests Alphabet may be overvalued by 11.2%. Discover 905 undervalued stocks or create your own screener to find better value opportunities.
Approach 2: Alphabet Price vs Earnings
For profitable companies like Alphabet, the price to earnings ratio is a useful yardstick because it directly links what investors are paying to the profits the business is generating today. A higher PE can be justified when investors expect faster earnings growth and see lower risk, while slower growing or riskier businesses typically deserve a lower, more conservative PE multiple.
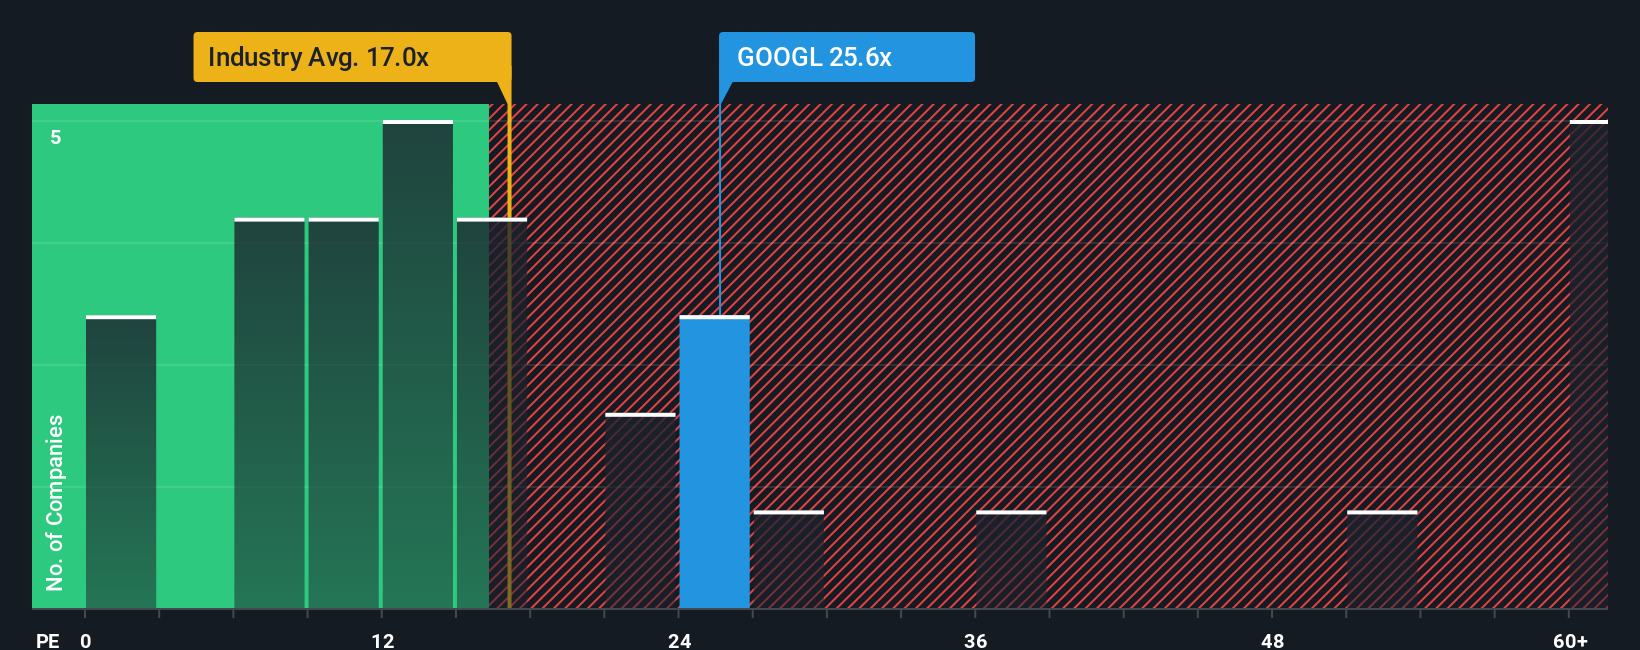
Alphabet currently trades on about 31.1x earnings. That is well above the broader Interactive Media and Services industry average of roughly 17.6x, but actually sits at a discount to large cap peers that average around 50.8x. To cut through those blunt comparisons, Simply Wall St uses a proprietary Fair Ratio, which estimates the PE a company should trade on after accounting for its earnings growth profile, profitability, industry positioning, market cap and specific risks. This tailored Fair Ratio for Alphabet is 37.4x, making it more informative than a one size fits all peer or industry comparison.
With the current 31.1x PE sitting below the 37.4x Fair Ratio, Alphabet screens as undervalued on a multiples basis.
Result: UNDERVALUED
PE ratios tell one story, but what if the real opportunity lies elsewhere? Discover 1448 companies where insiders are betting big on explosive growth.
Upgrade Your Decision Making: Choose your Alphabet Narrative
Earlier we mentioned that there is an even better way to understand valuation, so let's introduce you to Narratives, a simple framework on Simply Wall St's Community page that lets you connect your view of Alphabet's story to a concrete forecast and fair value, then automatically keeps that view up to date as new news or earnings arrive.
Instead of only looking at PE ratios or DCF outputs, a Narrative asks you to spell out your assumptions about how Alphabet's revenue, earnings and margins will evolve, ties those assumptions to a financial model, and calculates a fair value you can compare directly with the current share price to help you decide how you might approach the stock.
Because Narratives live on the platform and update dynamically as fresh information comes in, you can see how different investors interpret the same company, from a more cautious view that puts Alphabet's fair value around $171 per share to a far more optimistic stance closer to $340, and then decide where your own story and number sit on that spectrum.
For Alphabet however we will make it really easy for you with previews of two leading Alphabet Narratives:
Fair value: $340.00 per share
Implied undervaluation vs current price: -5.9%
Forecast revenue growth: 17.36%
- Sees Alphabet as a cash compounding platform anchored by dominant digital ads, a now profitable Google Cloud, and early but powerful AI monetisation across the stack.
- Highlights a fortress balance sheet, aggressive buybacks, and a portfolio of hidden assets like YouTube, Android, and Waymo that are not fully reflected in today’s multiple.
- Argues that Berkshire’s investment could support a higher long term P/E as markets re rate Alphabet closer to quality compounders like Apple, which could unlock upside beyond current expectations.
Fair value: $212.34 per share
Implied overvaluation vs current price: 50.8%
Forecast revenue growth: 13.47%
- Expects Google’s core search and ads and growing cloud revenues to remain resilient, but believes the market is already paying a full multiple for these steady, not explosive, growth drivers.
- Views generative AI as ultimately sustaining rather than disruptive, yet constrained near term by high compute costs and regulatory uncertainty, which may cap profitability and delay large scale monetisation.
- Models solid but more measured growth, with margins already ahead of prior expectations, and concludes that at current levels Alphabet trades materially above a reasonable long term fair value.
Do you think there's more to the story for Alphabet? Head over to our Community to see what others are saying!

This article by Simply Wall St is general in nature. We provide commentary based on historical data and analyst forecasts only using an unbiased methodology and our articles are not intended to be financial advice. It does not constitute a recommendation to buy or sell any stock, and does not take account of your objectives, or your financial situation. We aim to bring you long-term focused analysis driven by fundamental data. Note that our analysis may not factor in the latest price-sensitive company announcements or qualitative material. Simply Wall St has no position in any stocks mentioned.
Have feedback on this article? Concerned about the content? Get in touch with us directly. Alternatively, email editorial-team@simplywallst.com