
- LIVE QUOTES
- LEARN
- HELP
 Nasdaq
 Wall Street Journal
EN
Is Portland General Electric Still Attractive After 12% Gain and Cash Flow Concerns?
- If you are wondering whether Portland General Electric is quietly trading below its true value, or if the recent run up has already priced in the upside, you are in the right place to unpack what the numbers really say.
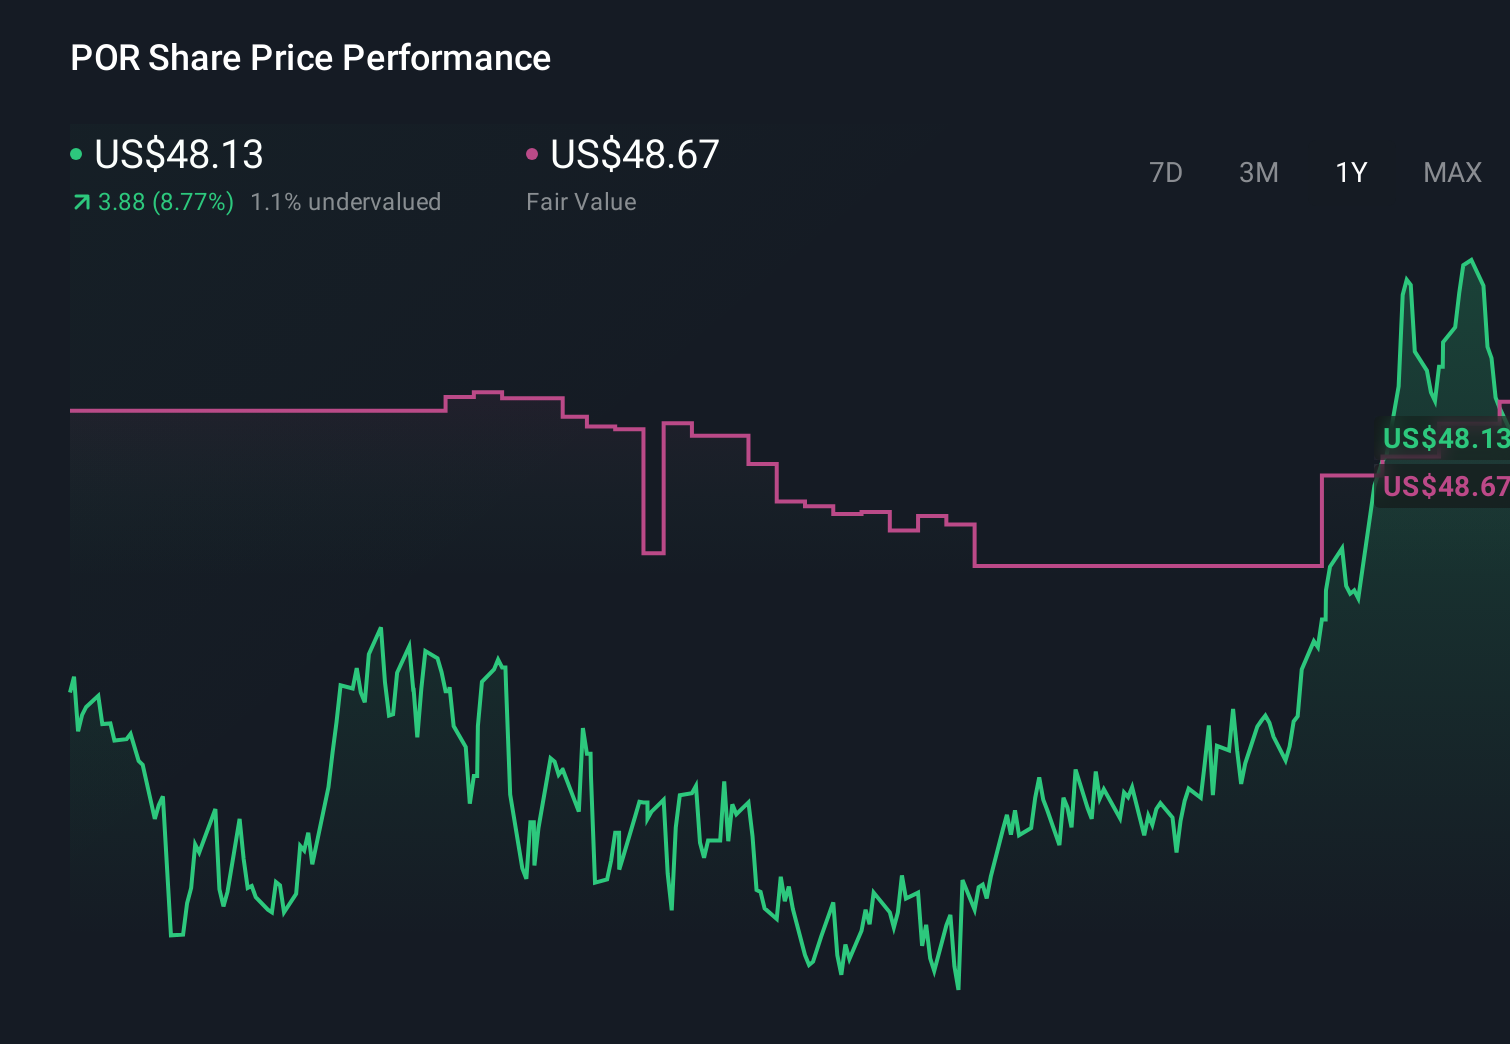
- The stock is up 11.6% year to date and 40.4% over five years, but its recent 1 year gain of 12.0% has cooled a little in the last week and month with returns of -2.3% and -1.4% respectively, hinting that sentiment might be pausing for breath.
- Investors have been reacting to a mix of regulatory updates, shifting expectations around future power demand in the Pacific Northwest, and ongoing discussions about grid modernization and renewable integration. In addition, sector wide moves in utilities as interest rate expectations evolve have also influenced how the market prices Portland General Electric today.
- Right now, Portland General Electric scores a 3/6 valuation check score, suggesting it screens as undervalued on half of the measures we use but not all of them. Next we will break down those different valuation approaches before circling back at the end to a more holistic way of thinking about what the stock is really worth.
Approach 1: Portland General Electric Discounted Cash Flow (DCF) Analysis
A Discounted Cash Flow, or DCF, model estimates what a company is worth by projecting its future cash flows and discounting them back into today’s dollars. This reflects risk and the time value of money.
For Portland General Electric, the latest twelve month Free Cash Flow is negative at about $212.19 Million, which means the company is currently consuming rather than generating cash for equity holders. Analysts expect this to turn around, with projected Free Cash Flow of $143 Million in 2026 and $64 Million by 2027. Simply Wall St then extrapolates more modest cash flows through 2035 based on these early forecasts.
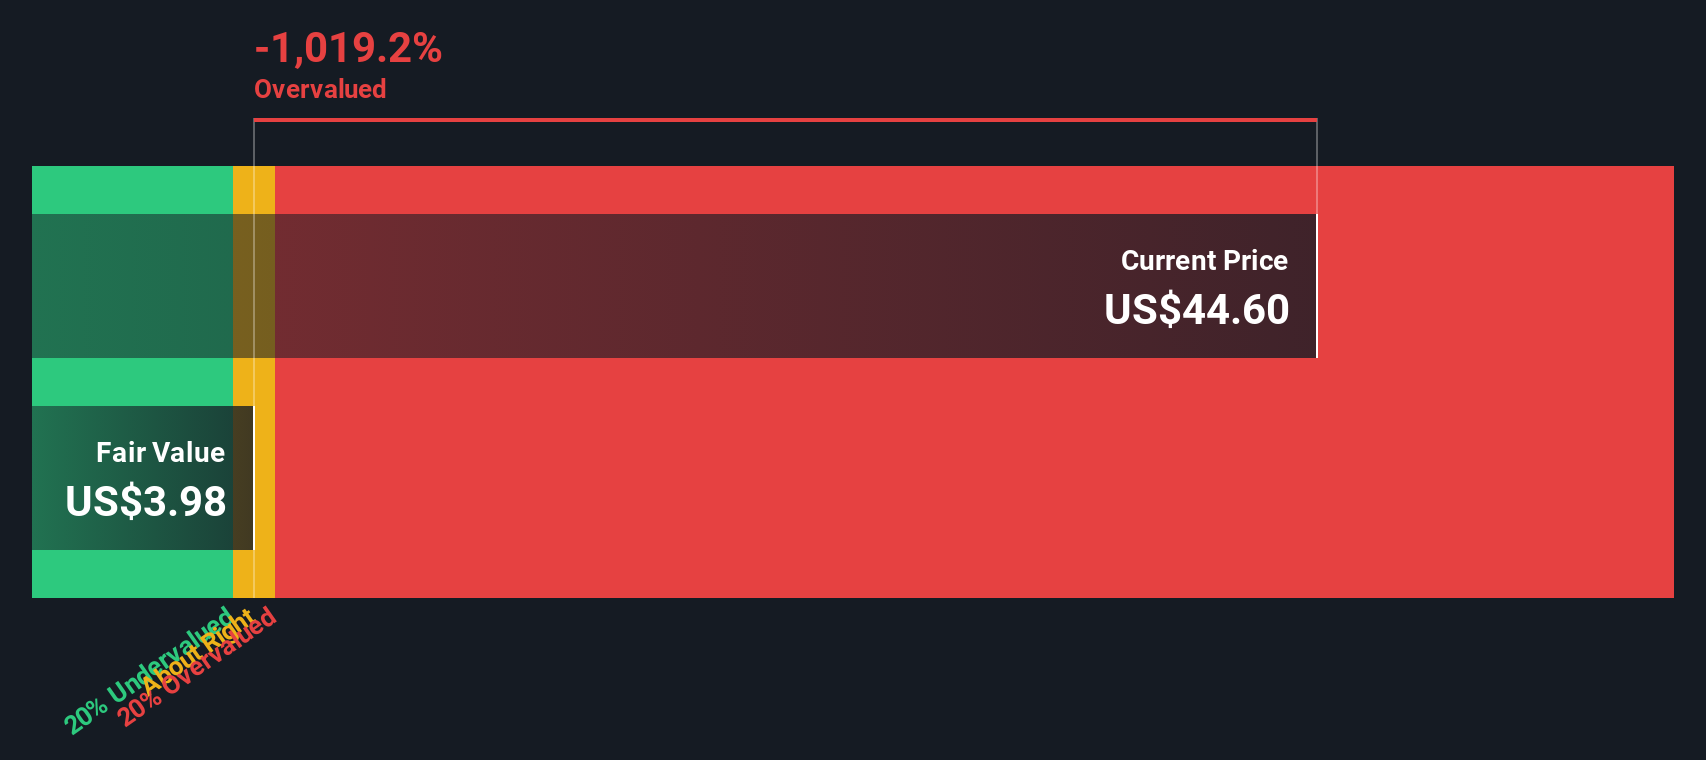
When all these projected cash flows are discounted back, the model produces an intrinsic value of roughly $3.85 per share. Compared with the current share price, this implies the stock is about 1153.2% above its DCF based fair value, which points to a substantial disconnect between price and long term cash flow fundamentals.
Result: OVERVALUED
Our Discounted Cash Flow (DCF) analysis suggests Portland General Electric may be overvalued by 1153.2%. Discover 894 undervalued stocks or create your own screener to find better value opportunities.
Approach 2: Portland General Electric Price vs Earnings
For a mature, consistently profitable utility like Portland General Electric, the Price to Earnings (PE) ratio is a practical way to gauge valuation because it directly links what investors pay to the profits the business generates today. In general, companies with stronger, more reliable growth and lower perceived risk tend to justify a higher, or more expensive, PE multiple, while slower growth or higher risk should command a lower, cheaper multiple.
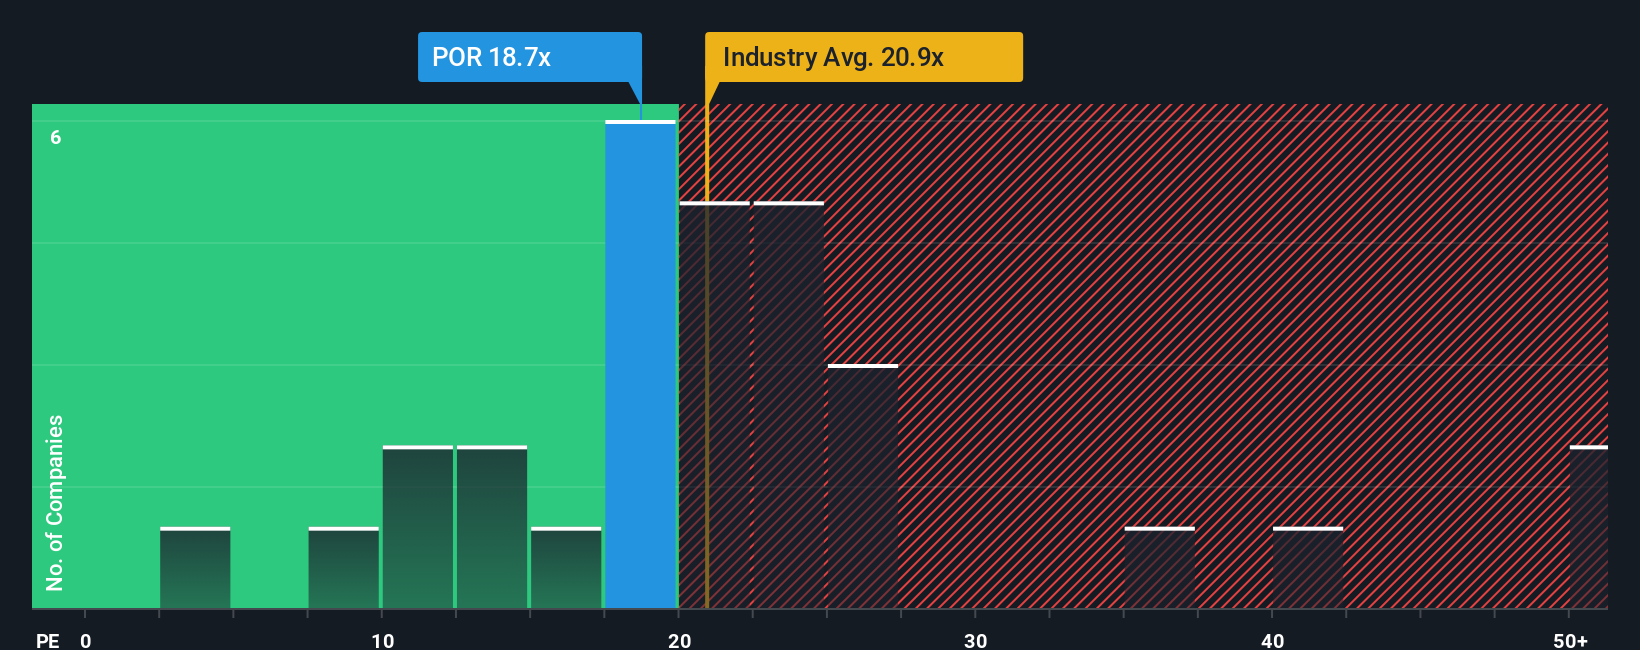
Portland General Electric currently trades on a PE of about 17.9x. That is below the Electric Utilities industry average of roughly 19.9x and also under the broader peer group average of around 24.6x. At first glance this makes the stock look modestly cheap. Simply Wall St also calculates a Fair Ratio of 21.5x, a proprietary estimate of the PE you would normally expect for this company once you factor in its earnings growth outlook, profit margins, risk profile, industry positioning and market capitalization.
Because the Fair Ratio incorporates these company specific drivers, it provides a more tailored benchmark than a simple comparison with peers or the sector. With the actual PE of 17.9x sitting below the Fair Ratio of 21.5x, the multiple-based view currently leans toward Portland General Electric being undervalued.
Result: UNDERVALUED
PE ratios tell one story, but what if the real opportunity lies elsewhere? Discover 1450 companies where insiders are betting big on explosive growth.
Upgrade Your Decision Making: Choose your Portland General Electric Narrative
Earlier we mentioned that there is an even better way to understand valuation, so let's introduce you to Narratives, a simple way to connect your view of Portland General Electric’s story with a clear financial forecast and a Fair Value estimate you can compare to today’s share price.
A Narrative on Simply Wall St is where you spell out what you think will happen to a company’s revenue, earnings and margins, and the multiple it deserves, then link that story to a forecast and an implied fair value, instead of relying only on static ratios like PE or broad analyst averages.
These Narratives live in the Community section of the platform, are easy to create and compare, and are updated dynamically whenever new information arrives, such as earnings releases, regulatory news or sector wide moves, so your Fair Value view stays current without extra work.
For example, one Narrative for Portland General Electric might lean bullish and justify a fair value near the most optimistic target around $58.00, based on stronger demand, constructive regulation and stable margins. In contrast, a more cautious Narrative could anchor closer to the $40.00 bear case, stressing regulatory risk, cost overruns and pressure on future returns, giving you a clear framework for deciding how you view the company versus today’s price.
Do you think there's more to the story for Portland General Electric? Head over to our Community to see what others are saying!
This article by Simply Wall St is general in nature. We provide commentary based on historical data and analyst forecasts only using an unbiased methodology and our articles are not intended to be financial advice. It does not constitute a recommendation to buy or sell any stock, and does not take account of your objectives, or your financial situation. We aim to bring you long-term focused analysis driven by fundamental data. Note that our analysis may not factor in the latest price-sensitive company announcements or qualitative material. Simply Wall St has no position in any stocks mentioned.
Have feedback on this article? Concerned about the content? Get in touch with us directly. Alternatively, email editorial-team@simplywallst.com