
- LIVE QUOTES
- LEARN
- HELP
 Nasdaq
 Wall Street Journal
EN
Okuma (TSE:6103): Does a Premium P/E Hide a Deep Value Opportunity?
Okuma (TSE:6103) has quietly turned in a strong stretch for shareholders, with the stock up about 10% over the past month and more than 20% over the past year, outpacing many industrial peers.
See our latest analysis for Okuma.
The recent pullback in Okuma’s 7 day share price return looks more like a breather than a reversal, given its double digit 1 month share price gain and healthy multi year total shareholder returns.
If Okuma’s steady recovery has you thinking about where else momentum and ownership might line up, now is a good time to explore fast growing stocks with high insider ownership.
Yet with shares still trading below analyst targets and our estimates pointing to a sizable intrinsic discount, the real question is whether Okuma is a mispriced value story or if the market already sees its next leg of growth.
Price-to-Earnings of 21.4x: Is it justified?
Okuma trades on a price-to-earnings ratio of 21.4 times at a last close of ¥3,740, placing it on a clear premium footing versus peers.
The price-to-earnings multiple compares the company’s current share price with its earnings per share and is a common yardstick for machinery manufacturers, where profitability and cash generation are closely watched. Paying a higher P E ratio effectively means investors are willing to pay more today for each unit of Okuma’s current earnings.
For Okuma, that premium sits uncomfortably against several fundamentals. The stock is described as expensive versus both the Japanese machinery industry average of 12.6 times and a peer group average of 13.5 times, and even above an estimated fair P E of 19.7 times. At the same time, reported earnings shrank over the past year and return on equity is currently low, which suggests the market is already pricing in a meaningful rebound in profitability.
Against the broader industry backdrop, the gap is stark. Okuma’s 21.4 times P E towers over the 12.6 times industry norm and the 13.5 times peer average, indicating investors are assigning it a much richer valuation than many competitors despite recent earnings pressure and lower profit margins.
Explore the SWS fair ratio for Okuma
Result: Price-to-Earnings of 21.4x (OVERVALUED)
However, sustained earnings pressure or a sharper slowdown in machinery demand could quickly challenge the market’s optimistic valuation and growth expectations.
Find out about the key risks to this Okuma narrative.
Another View: Intrinsic Value Tells a Different Story
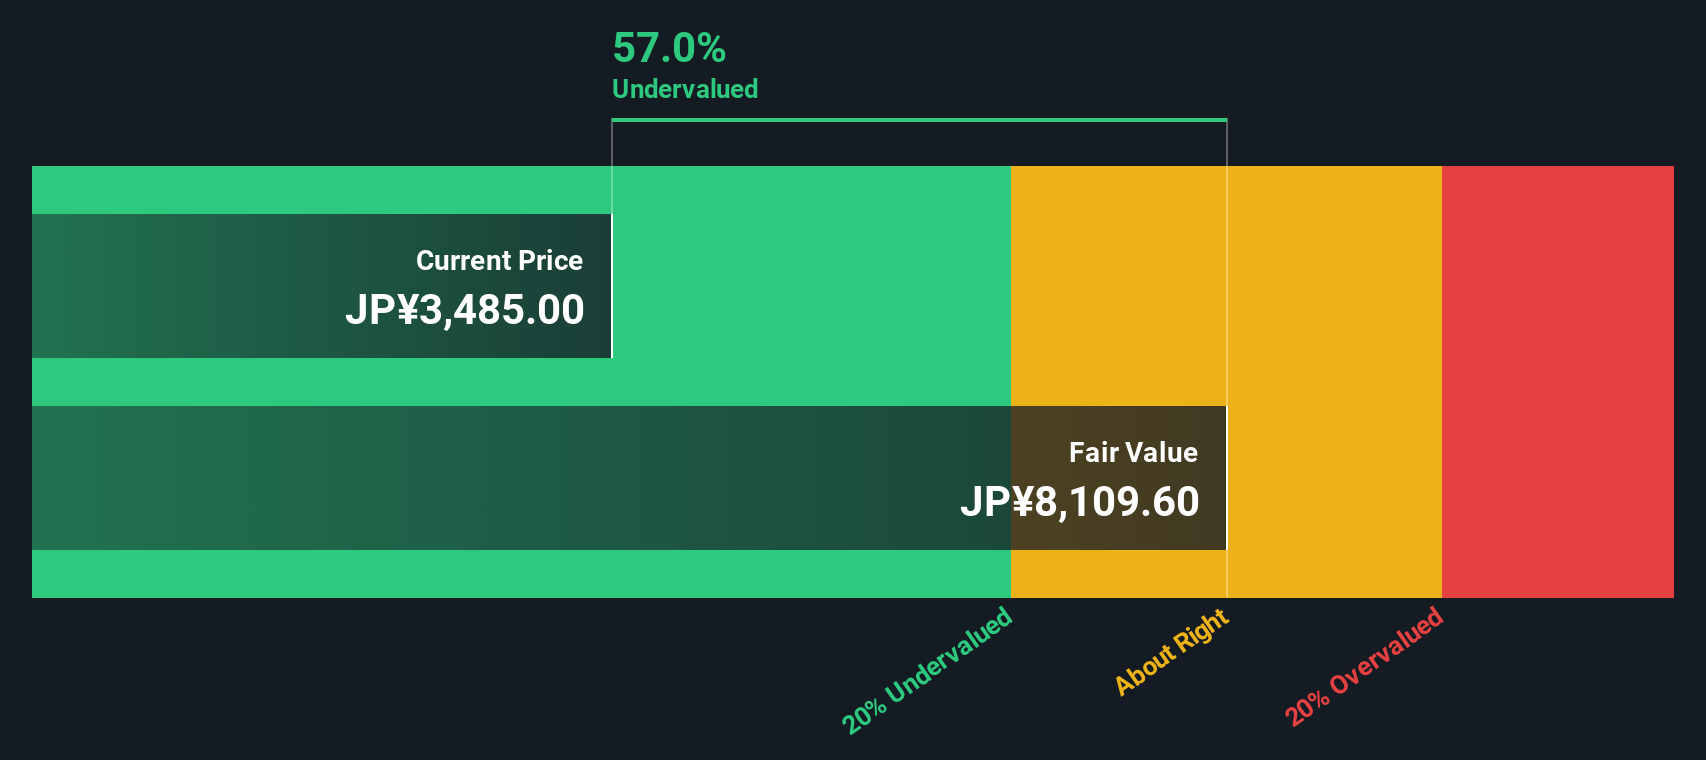
While the 21.4 times earnings multiple flags Okuma as expensive versus peers, our DCF model paints almost the opposite picture, suggesting the shares trade around 52% below fair value at roughly ¥7,812. If both cannot be right, which signal do you trust?
Look into how the SWS DCF model arrives at its fair value.
Simply Wall St performs a discounted cash flow (DCF) on every stock in the world every day (check out Okuma for example). We show the entire calculation in full. You can track the result in your watchlist or portfolio and be alerted when this changes, or use our stock screener to discover 899 undervalued stocks based on their cash flows. If you save a screener we even alert you when new companies match - so you never miss a potential opportunity.
Build Your Own Okuma Narrative
If you see the numbers differently or prefer to dig into the data yourself, you can build a personalised view of Okuma in minutes: Do it your way.
A great starting point for your Okuma research is our analysis highlighting 2 key rewards and 1 important warning sign that could impact your investment decision.
Ready for more high conviction ideas?
Do not stop at one opportunity. Use the Simply Wall St Screener today to uncover focused stock ideas that other investors will only notice later.
- Harness potential market mispricings by scanning these 899 undervalued stocks based on cash flows that may be trading below their intrinsic worth and primed for a sentiment shift.
- Target powerful structural themes by zeroing in on these 27 AI penny stocks riding the surge in artificial intelligence adoption across industries.
- Lock in reliable income prospects by filtering for these 15 dividend stocks with yields > 3% that can strengthen your portfolio with steady cash returns.
This article by Simply Wall St is general in nature. We provide commentary based on historical data and analyst forecasts only using an unbiased methodology and our articles are not intended to be financial advice. It does not constitute a recommendation to buy or sell any stock, and does not take account of your objectives, or your financial situation. We aim to bring you long-term focused analysis driven by fundamental data. Note that our analysis may not factor in the latest price-sensitive company announcements or qualitative material. Simply Wall St has no position in any stocks mentioned.
Have feedback on this article? Concerned about the content? Get in touch with us directly. Alternatively, email editorial-team@simplywallst.com