
- LIVE QUOTES
- LEARN
- HELP
 Nasdaq
 Wall Street Journal
EN
Global Penny Stocks To Watch In December 2025
As global markets navigate the anticipation of potential interest rate cuts and mixed economic signals, investors are keenly observing the shifts in major indices. Penny stocks, a term that may seem dated but remains relevant, offer intriguing opportunities for those interested in smaller or newer companies. These stocks can provide growth potential at lower price points when backed by strong financials, making them an appealing option for investors seeking hidden gems with long-term promise.
Top 10 Penny Stocks Globally
| Name | Share Price | Market Cap | Rewards & Risks |
| Lever Style (SEHK:1346) | HK$1.47 | HK$909.23M | ✅ 4 ⚠️ 1 View Analysis > |
| Foresight Group Holdings (LSE:FSG) | £4.10 | £467.57M | ✅ 5 ⚠️ 0 View Analysis > |
| TK Group (Holdings) (SEHK:2283) | HK$2.61 | HK$2.22B | ✅ 4 ⚠️ 1 View Analysis > |
| Angler Gaming (NGM:ANGL) | SEK3.60 | SEK269.95M | ✅ 4 ⚠️ 2 View Analysis > |
| Angler Gaming (DB:0QM) | €0.37 | €231.7M | ✅ 3 ⚠️ 3 View Analysis > |
| CNMC Goldmine Holdings (Catalist:5TP) | SGD1.02 | SGD413.39M | ✅ 4 ⚠️ 1 View Analysis > |
| Yangzijiang Shipbuilding (Holdings) (SGX:BS6) | SGD3.43 | SGD13.5B | ✅ 5 ⚠️ 1 View Analysis > |
| Integrated Diagnostics Holdings (LSE:IDHC) | $0.675 | $392.4M | ✅ 4 ⚠️ 2 View Analysis > |
| RGB International Bhd (KLSE:RGB) | MYR0.21 | MYR323.58M | ✅ 4 ⚠️ 3 View Analysis > |
| Begbies Traynor Group (AIM:BEG) | £1.105 | £176.36M | ✅ 4 ⚠️ 2 View Analysis > |
Click here to see the full list of 3,578 stocks from our Global Penny Stocks screener.
Let's explore several standout options from the results in the screener.
Guangxi Fenglin Wood Industry GroupLtd (SHSE:601996)
Simply Wall St Financial Health Rating: ★★★★☆☆
Overview: Guangxi Fenglin Wood Industry Group Co., Ltd operates in China, focusing on the production and sale of wood-based panels and afforestation, with a market cap of CN¥2.85 billion.
Operations: Guangxi Fenglin Wood Industry Group Co., Ltd has not reported any specific revenue segments.
Market Cap: CN¥2.85B
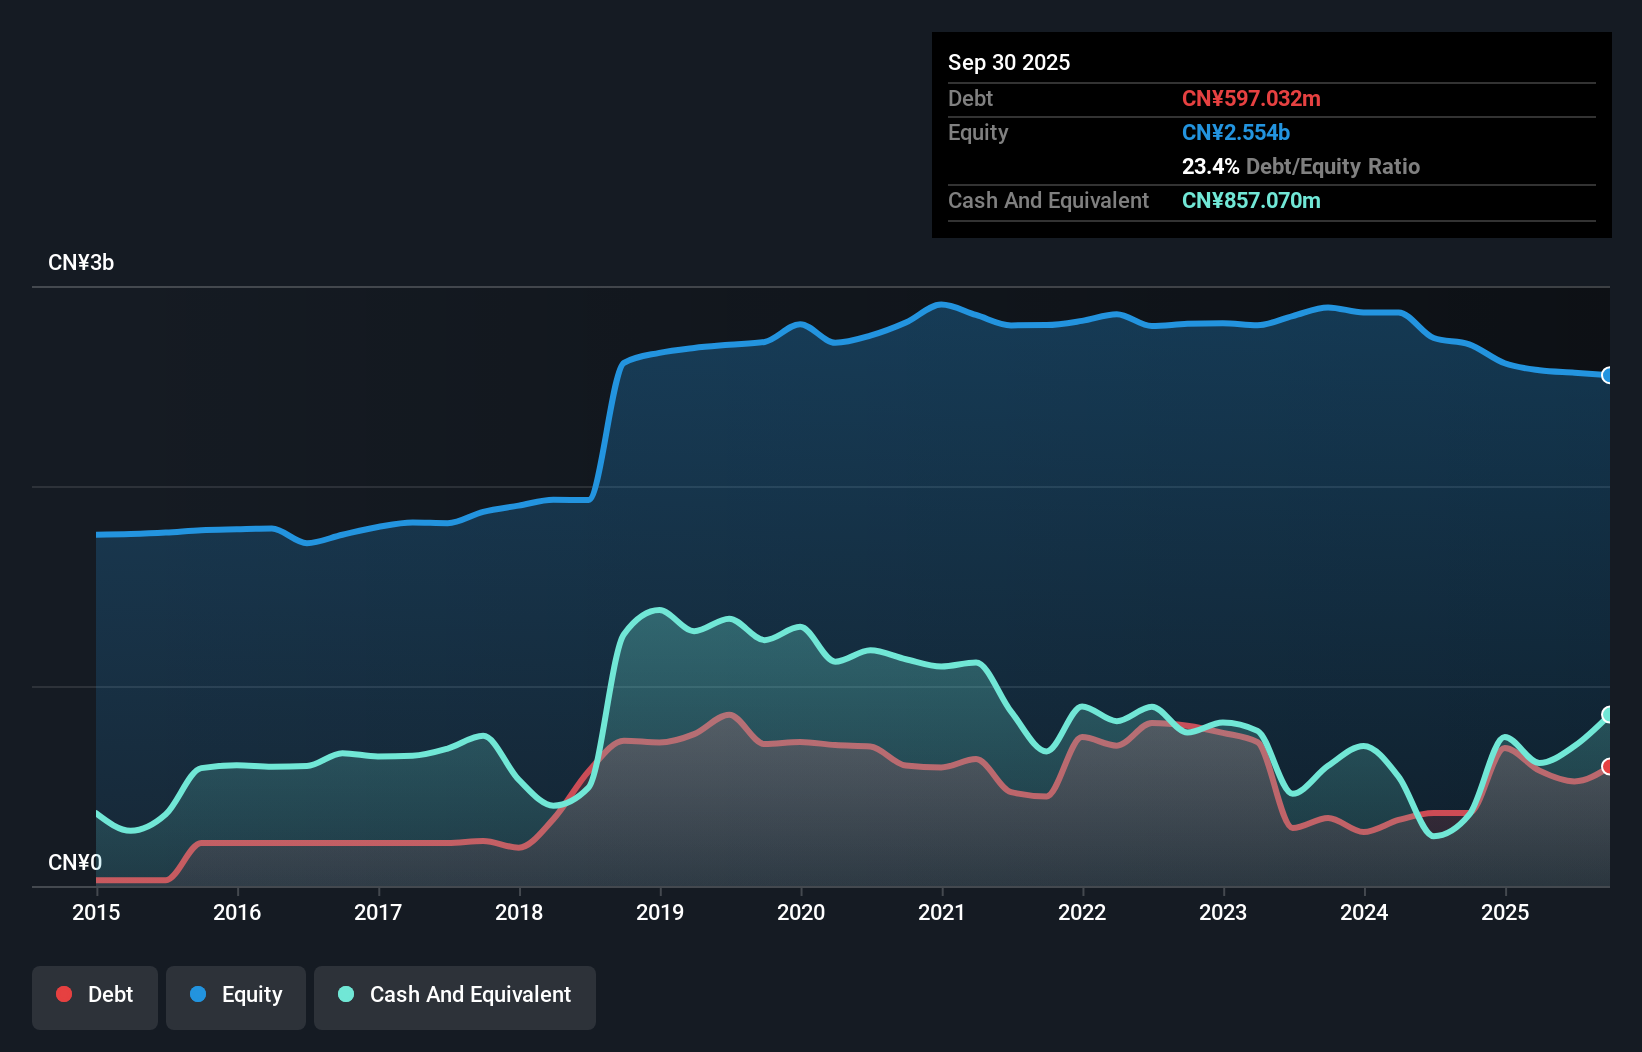
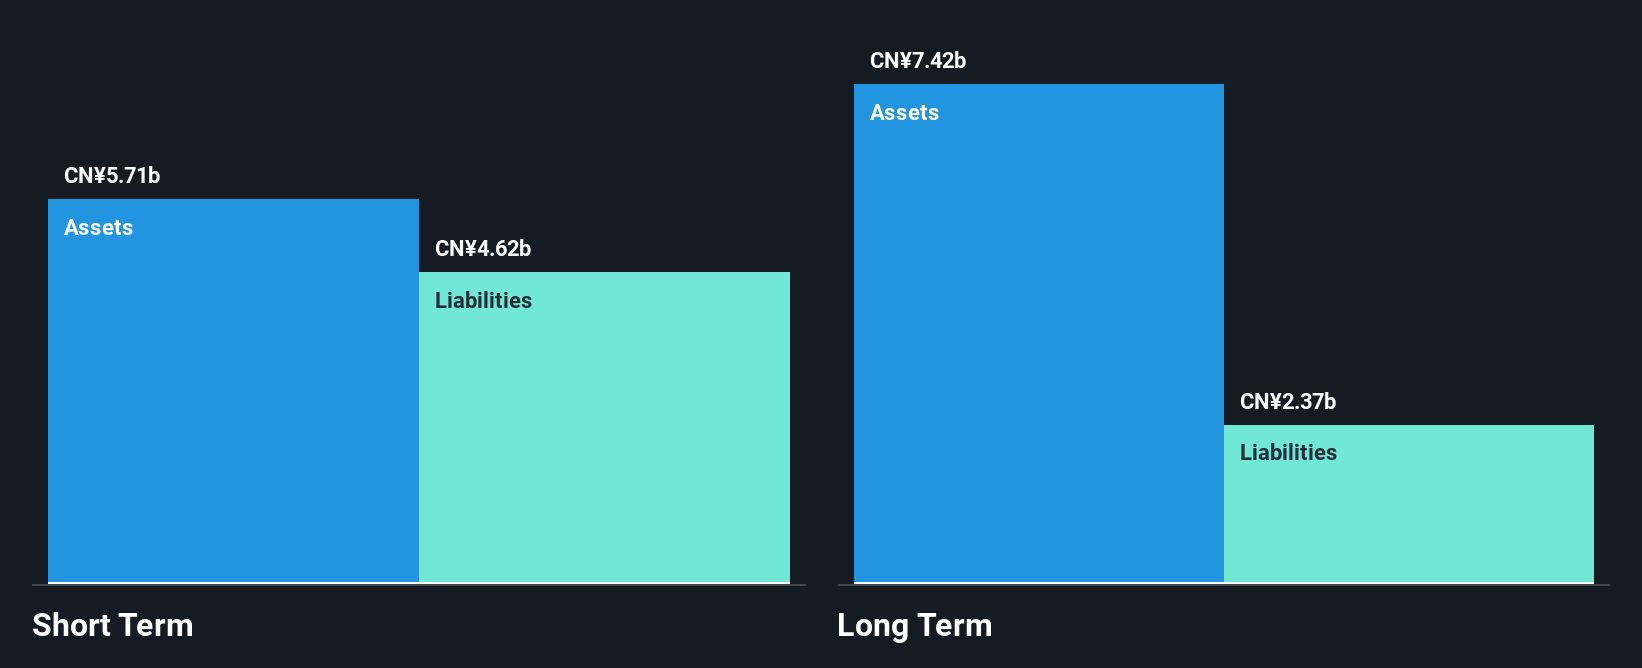
Guangxi Fenglin Wood Industry Group Co., Ltd, with a market cap of CN¥2.85 billion, reported sales of CN¥1.26 billion for the first nine months of 2025, down from CN¥1.51 billion the previous year, resulting in a net loss of CN¥59.35 million. Despite being unprofitable and experiencing increased losses over five years, its short-term assets exceed both long-term and short-term liabilities significantly. The company’s debt is well-covered by operating cash flow and it trades below estimated fair value by 28.7%. The board is experienced with an average tenure of 3.5 years but management experience data is insufficient.
- Take a closer look at Guangxi Fenglin Wood Industry GroupLtd's potential here in our financial health report.
- Assess Guangxi Fenglin Wood Industry GroupLtd's previous results with our detailed historical performance reports.
China Fangda Group (SZSE:000055)
Simply Wall St Financial Health Rating: ★★★★☆☆
Overview: China Fangda Group Co., Ltd. is involved in the production and sales of curtain wall materials in China, with a market cap of CN¥3.43 billion.
Operations: The company has not reported any specific revenue segments.
Market Cap: CN¥3.43B
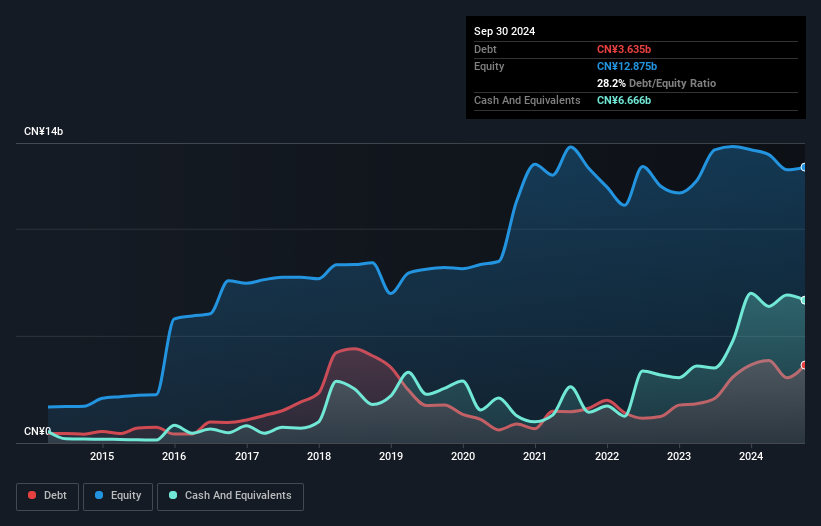
China Fangda Group Co., Ltd. has a market cap of CN¥3.43 billion and reported sales of CN¥2,559.3 million for the first nine months of 2025, down from CN¥3,206.56 million the previous year, with net income dropping to CN¥15.89 million from CN¥149.71 million a year ago. The company's short-term assets exceed its liabilities significantly; however, profitability challenges persist with a net profit margin at 0.3%, lower than last year's 3.6%. Although debt levels are satisfactory with a net debt to equity ratio at 30%, interest coverage remains weak and earnings growth has been negative over recent years.
- Click here to discover the nuances of China Fangda Group with our detailed analytical financial health report.
- Review our historical performance report to gain insights into China Fangda Group's track record.
Leo Group (SZSE:002131)
Simply Wall St Financial Health Rating: ★★★★☆☆
Overview: Leo Group Co., Ltd. primarily offers digital marketing services in China and has a market cap of CN¥32.34 billion.
Operations: Leo Group Co., Ltd. does not report specific revenue segments.
Market Cap: CN¥32.34B
Leo Group Co., Ltd. has shown improvement by becoming profitable this year, reporting a net income of CN¥588.9 million for the first nine months of 2025, reversing a loss from the previous year. Despite earnings declining by an average of 38.8% annually over the past five years, recent profitability marks a positive shift. The company maintains more cash than total debt and short-term assets significantly exceed both short and long-term liabilities, indicating strong liquidity positions. However, high share price volatility persists and one-off gains have notably impacted financial results recently, suggesting caution in evaluating sustainable profit growth trends.
- Unlock comprehensive insights into our analysis of Leo Group stock in this financial health report.
- Learn about Leo Group's historical performance here.
Summing It All Up
- Jump into our full catalog of 3,578 Global Penny Stocks here.
- Interested In Other Possibilities? Trump's oil boom is here — pipelines are primed to profit. Discover the 22 US stocks riding the wave.
This article by Simply Wall St is general in nature. We provide commentary based on historical data and analyst forecasts only using an unbiased methodology and our articles are not intended to be financial advice. It does not constitute a recommendation to buy or sell any stock, and does not take account of your objectives, or your financial situation. We aim to bring you long-term focused analysis driven by fundamental data. Note that our analysis may not factor in the latest price-sensitive company announcements or qualitative material. Simply Wall St has no position in any stocks mentioned.
Have feedback on this article? Concerned about the content? Get in touch with us directly. Alternatively, email editorial-team@simplywallst.com