
- LIVE QUOTES
- LEARN
- HELP
 Nasdaq
 Wall Street Journal
EN
AST SpaceMobile (ASTS): Revisiting Valuation After BlueBird 6 Launch Plans and New Commercial Agreements
The upcoming launch of BlueBird 6 has put AST SpaceMobile (ASTS) firmly back on traders screens, as investors connect this higher capacity satellite to the company s broader commercial rollout.
See our latest analysis for AST SpaceMobile.
Those catalysts have clearly caught the market s eye, with the share price at about $73.92 and a powerful year to date share price return of roughly 242% signalling strong, momentum driven expectations around the launches, new facilities, and billion dollar agreements.
If this kind of satellite fueled rerating has you curious about what else is moving, it might be worth scanning other high growth tech names through high growth tech and AI stocks.
Yet even with more than $1 billion in contracted revenue and a vertically integrated US manufacturing base, AST SpaceMobile still trades below some intrinsic value estimates. This raises the key question: is this a genuine buying opportunity, or is the market already pricing in future growth?
Price to Book of 16.7x: Is it justified?
AST SpaceMobile currently trades on a rich price to book ratio of 16.7 times, signalling the market is pricing in aggressive future success versus peers.
Price to book compares a company's market value to the net assets on its balance sheet, a common yardstick in capital intensive, asset heavy sectors like telecom and satellite infrastructure. When this ratio stretches far above norms, it usually means investors are paying well beyond the accounting value of assets for expected growth and future profitability.
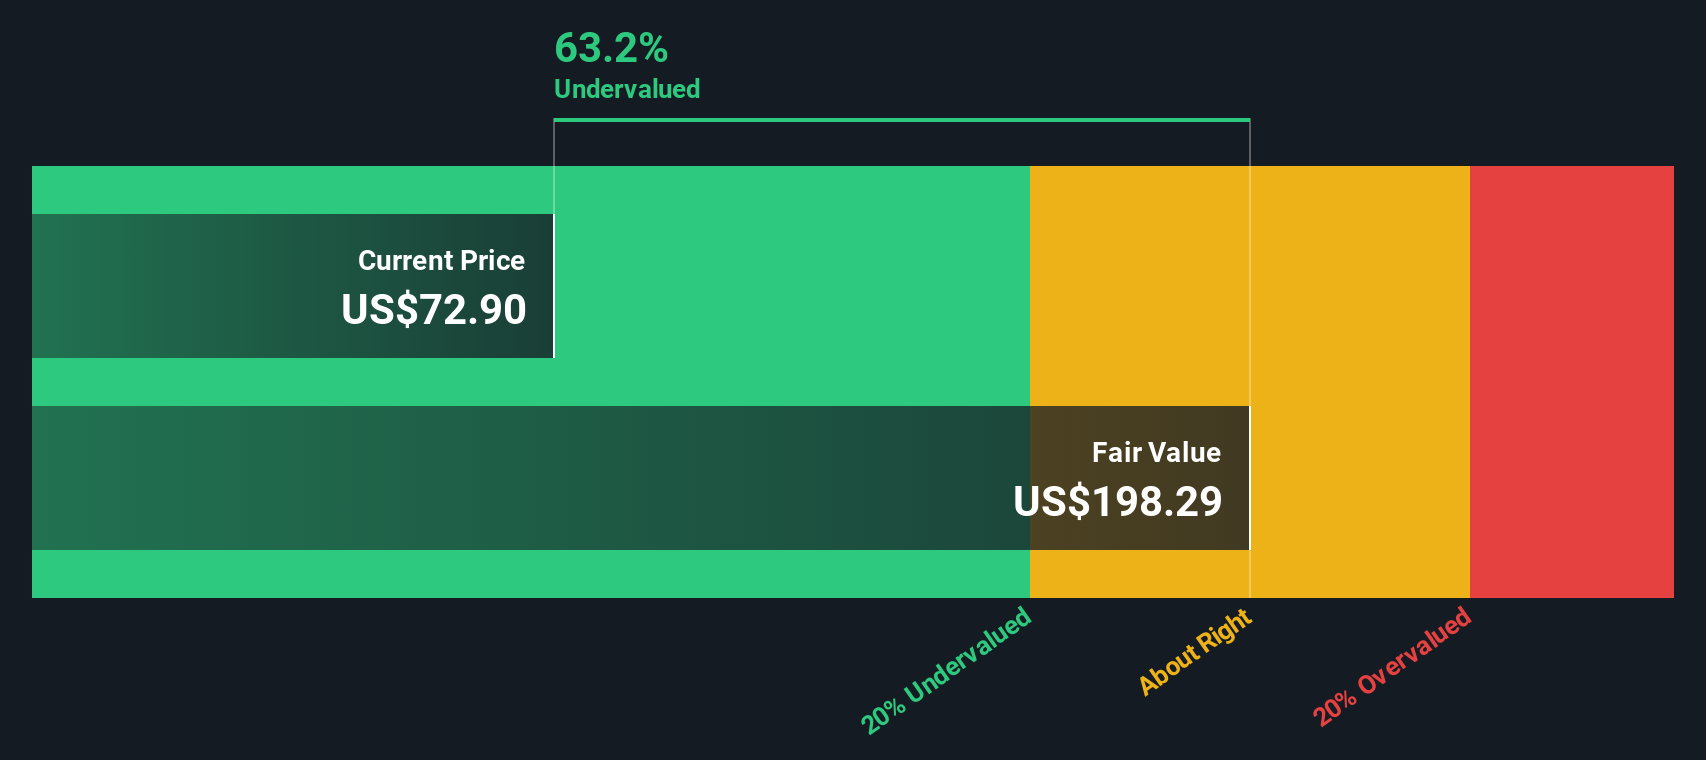
In AST SpaceMobile's case, that premium sits alongside a business that is still unprofitable today, with a negative return on equity of about 25.55% and no track record of consistent earnings yet. The SWS DCF model, however, suggests a very different picture. It indicates ASTS at $73.92 is trading roughly 62% below an estimated fair value of $194.42 and implies the market may not yet be fully reflecting the company's forecast revenue and earnings ramp in its current book based valuation.
Relative to the US telecom industry's average price to book of just 1.2 times, AST SpaceMobile's 16.7 times reading is extreme. It underlines how much more investors are willing to pay for each dollar of net assets here versus a typical telco. That kind of gap speaks to a high conviction growth story tied to its satellite constellation and projected profitability, but it also leaves little room for disappointment if execution or timelines slip.
See what the numbers say about this price — find out in our valuation breakdown.
Result: Price to book of 16.7x (OVERVALUED).
However, there are still clear risks, including further execution delays or overruns, and the possibility that revenue growth lags lofty market expectations.
Find out about the key risks to this AST SpaceMobile narrative.
Another View on Value
While the 16.7 times price to book ratio suggests optimism, our DCF model points to a different perspective, indicating that AST SpaceMobile may be trading about 62% below an estimated fair value of $194.42. Is the market underestimating long term cash flows, or is the model too generous?
Look into how the SWS DCF model arrives at its fair value.
Simply Wall St performs a discounted cash flow (DCF) on every stock in the world every day (check out AST SpaceMobile for example). We show the entire calculation in full. You can track the result in your watchlist or portfolio and be alerted when this changes, or use our stock screener to discover 907 undervalued stocks based on their cash flows. If you save a screener we even alert you when new companies match - so you never miss a potential opportunity.
Build Your Own AST SpaceMobile Narrative
If this viewpoint does not fully align with yours, or you prefer to dig into the numbers yourself, you can easily build a tailored narrative in just a few minutes: Do it your way.
A great starting point for your AST SpaceMobile research is our analysis highlighting 2 key rewards and 2 important warning signs that could impact your investment decision.
Looking for more investment ideas?
Before you move on, consider scanning focused stock ideas on Simply Wall Street to help identify your next potential opportunity, instead of waiting for the market to move first.
- Explore potential faster growth by reviewing these 26 AI penny stocks that are linked to structural demand for data, automation, and intelligent software.
- Strengthen your portfolio’s foundation with these 907 undervalued stocks based on cash flows that may offer upside based on cash flows rather than hype.
- Evaluate your income stream by assessing these 15 dividend stocks with yields > 3% that combine yields with balance sheet support.
This article by Simply Wall St is general in nature. We provide commentary based on historical data and analyst forecasts only using an unbiased methodology and our articles are not intended to be financial advice. It does not constitute a recommendation to buy or sell any stock, and does not take account of your objectives, or your financial situation. We aim to bring you long-term focused analysis driven by fundamental data. Note that our analysis may not factor in the latest price-sensitive company announcements or qualitative material. Simply Wall St has no position in any stocks mentioned.
Have feedback on this article? Concerned about the content? Get in touch with us directly. Alternatively, email editorial-team@simplywallst.com