
- LIVE QUOTES
- LEARN
- HELP
 Nasdaq
 Wall Street Journal
EN
Does Uber Still Have Room To Run After Its 2025 Share Price Surge?
- Wondering if Uber Technologies at around $90.99 is still a buy after its big run or if the upside has already been taken? This article will walk you through what the numbers are really saying about its value.
- Uber has been on a strong multi year tear, up 242.7% over 3 years and 72.9% over 5 years, with a 44.0% gain year to date even though the last 30 days have seen a modest -1.9% pullback and the past week a 3.9% rebound.
- Those moves are unfolding against a backdrop of Uber doubling down on its platform strategy, expanding in delivery, rides, and advertising, and pushing further into profitability as the business scales globally. Investors have also been reacting to regulatory developments in key markets, as well as growing confidence that ride hailing and delivery demand is holding up despite a mixed macro environment.
- On our checks, Uber scores a perfect 6 out of 6 on our undervaluation framework, giving it a valuation score of 6/6. Next we will break down how different valuation approaches see the stock and then finish with a more intuitive way to think about what that score really means.
Approach 1: Uber Technologies Discounted Cash Flow (DCF) Analysis
A Discounted Cash Flow model estimates what a business is worth by projecting the cash it can generate in the future and discounting those cash flows back to today in dollar terms.
For Uber Technologies, the latest twelve months Free Cash Flow is about $8.7 billion. Analysts, together with Simply Wall St extrapolations, see this rising steadily over the coming decade. By 2035, projected annual Free Cash Flow is estimated at roughly $23.4 billion, reflecting strong expected scaling of the platform and improving profitability. These projections are modeled using a 2 Stage Free Cash Flow to Equity approach, where earlier years grow faster before growth tapers in the longer term.
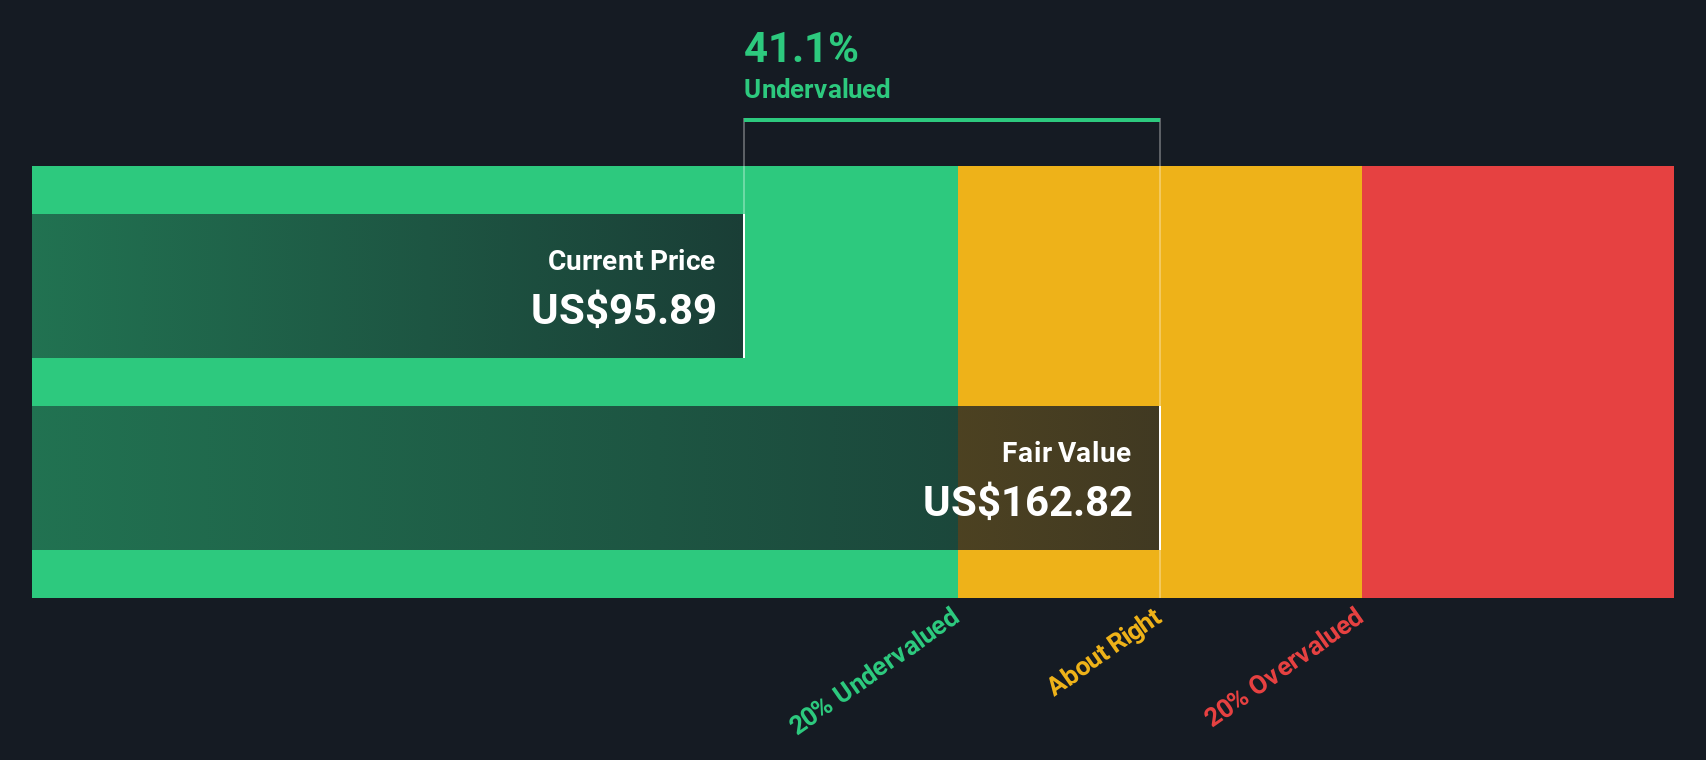
When all those future dollar cash flows are discounted back to today, the DCF model suggests an intrinsic value of about $167.39 per share. Compared with the current share price around $90.99, this implies the stock is roughly 45.6% undervalued on this basis.
Result: UNDERVALUED
Our Discounted Cash Flow (DCF) analysis suggests Uber Technologies is undervalued by 45.6%. Track this in your watchlist or portfolio, or discover 908 more undervalued stocks based on cash flows.
Approach 2: Uber Technologies Price vs Earnings
For a profitable company like Uber, the price to earnings, or PE, ratio is a useful shorthand for how much investors are willing to pay today for each dollar of current earnings. It naturally ties together expectations for future growth and the risks investors see in those earnings continuing.
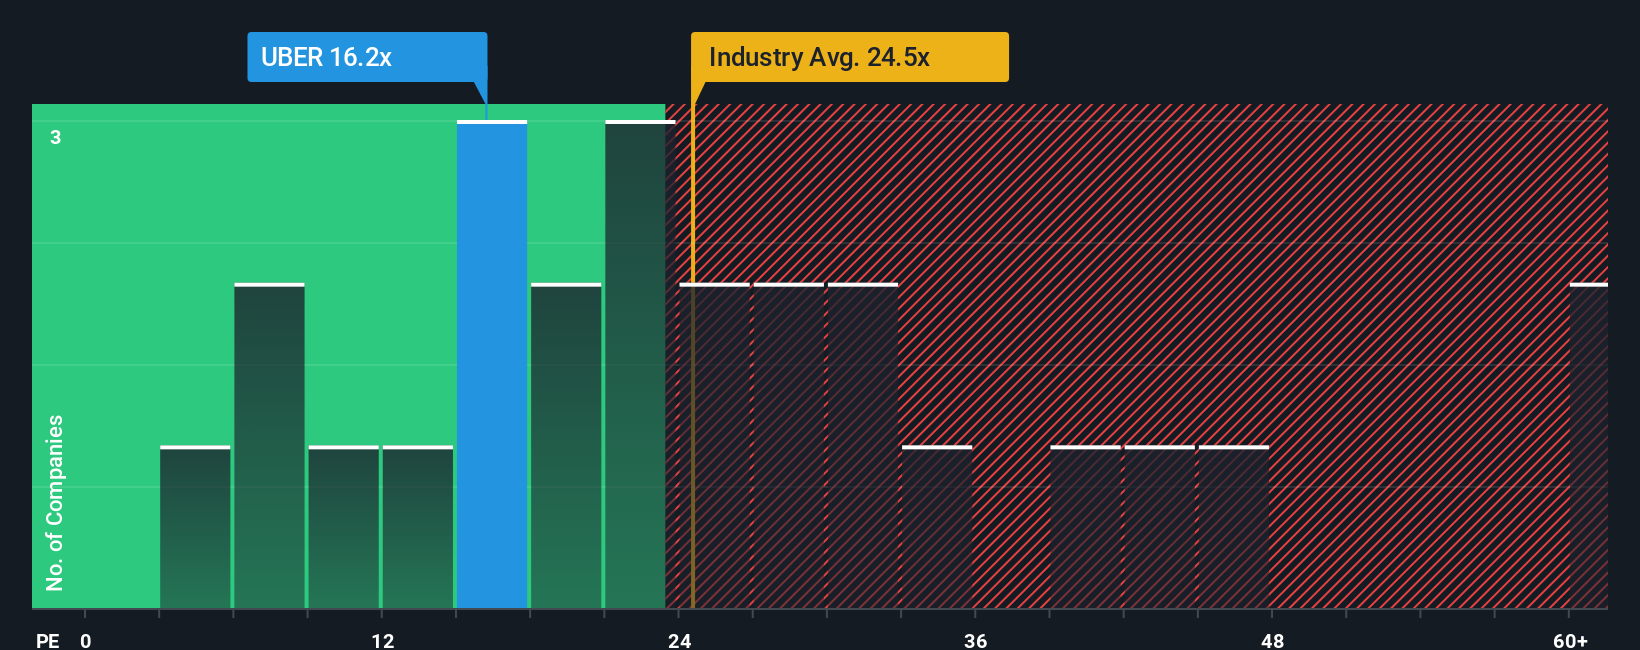
In general, faster growing, more resilient businesses tend to justify a higher, fair PE ratio, while slower or riskier names command a lower one. Uber currently trades on a PE of about 11.36x, which is well below the Transportation industry average of roughly 30.77x and far under the broader peer group average near 70.10x. That big gap suggests the market is still pricing Uber more cautiously than many of its listed peers.
Simply Wall St’s Fair Ratio framework estimates what multiple a stock should trade on given its earnings growth, profitability, industry, size and risk profile. For Uber, that Fair PE Ratio is around 14.32x, meaning the shares look undervalued relative to what those fundamentals would normally justify. Because this approach is tailored to Uber’s own characteristics rather than a blunt peer comparison, it offers a more nuanced view, and on that basis, the stock appears to have further upside.
Result: UNDERVALUED
PE ratios tell one story, but what if the real opportunity lies elsewhere? Discover 1442 companies where insiders are betting big on explosive growth.
Upgrade Your Decision Making: Choose your Uber Technologies Narrative
Earlier we mentioned that there is an even better way to understand valuation, so let us introduce you to Narratives, a simple way to connect the story you believe about a company with a concrete financial forecast and a Fair Value that you can compare to today’s Price. On Simply Wall St’s Community page, Narratives let millions of investors explain the assumptions behind their numbers, from revenue growth and profit margins to the multiple they think Uber deserves, then turn that outlook into an explicit Fair Value that updates automatically as new news, earnings or guidance comes in. For Uber, one Narrative might focus on more conservative growth and margins, leading to a Fair Value near $75 per share and a preference to buy only if the price falls. In contrast, a more optimistic Narrative might lean into autonomous driving, platform engagement and higher long term profitability, supporting a Fair Value around $111 and a view that the current price still offers upside.
For Uber Technologies, however, we will make it really easy for you with previews of two leading Uber Technologies Narratives:
Fair value: $111.06 per share
Implied undervaluation versus $90.99: 18.1%
Forecast revenue growth: 14.59% per year
- Sees Uber’s multi modal platform, cross selling between Mobility and Delivery, and products like Uber One as key drivers of higher engagement, stronger retention, and long run margin expansion.
- Assumes continued investment in autonomous vehicles, electrification, and high margin services such as advertising will deepen competitive advantages and support durable earnings power.
- Accepts execution, regulatory, and margin risks, but ultimately argues that scale, technology, and ecosystem effects justify a higher future PE multiple and a fair value around $111 per share.
Fair value: $75.00 per share
Implied overvaluation versus $90.99: 21.3%
Forecast revenue growth: 4.2% per year
- Highlights that while revenue, profitability, and free cash flow are improving, today’s $192 billion market cap already prices in a very optimistic long term outcome.
- Models 2030 revenue of $65 to $70 billion and EBITDA margins around 22%, then concludes that this supports a fair value range closer to $90 to $135 billion in market cap.
- Views the current share price as significantly ahead of fundamentals and prefers a more cautious entry zone of $65 to $75 per share to provide a better margin of safety.
Do you think there's more to the story for Uber Technologies? Head over to our Community to see what others are saying!
This article by Simply Wall St is general in nature. We provide commentary based on historical data and analyst forecasts only using an unbiased methodology and our articles are not intended to be financial advice. It does not constitute a recommendation to buy or sell any stock, and does not take account of your objectives, or your financial situation. We aim to bring you long-term focused analysis driven by fundamental data. Note that our analysis may not factor in the latest price-sensitive company announcements or qualitative material. Simply Wall St has no position in any stocks mentioned.
Have feedback on this article? Concerned about the content? Get in touch with us directly. Alternatively, email editorial-team@simplywallst.com