
- LIVE QUOTES
- LEARN
- HELP
 Nasdaq
 Wall Street Journal
EN
Is It Too Late To Consider Solaris Energy Infrastructure After Its 87.2% 2025 Surge?
- If you are wondering whether Solaris Energy Infrastructure is still worth considering after its huge run, or if you have missed the move, you are in the right place. This stock’s price action and fundamentals tell an interesting valuation story.
- The share price has surged to around $55, jumping 15.1% over the last week and taking its year-to-date gain to 87.2%, with a 111.1% return over the past year and 596.1% over five years that has clearly changed how the market views its potential.
- Recent headlines have focused on Solaris winning new long term pipeline capacity contracts tied to LNG export projects, while also securing regulatory approval to expand a key midstream corridor that links shale basins to Gulf Coast terminals. At the same time, investors have been watching policy developments around U.S. energy infrastructure permitting and transmission upgrades, which adds another layer of momentum and risk perception to the stock.
- Despite all of that optimism, Solaris only scores a 2/6 on our valuation checks. This suggests the market may be pricing in a lot of growth already. Next we will unpack how different valuation approaches line up for this stock and then circle back to an even better way of thinking about what it is really worth.
Solaris Energy Infrastructure scores just 2/6 on our valuation checks. See what other red flags we found in the full valuation breakdown.
Approach 1: Solaris Energy Infrastructure Discounted Cash Flow (DCF) Analysis
A Discounted Cash Flow model takes forecasts of a company’s future cash flows and discounts them back to today’s value, aiming to estimate what the entire business is worth right now. For Solaris Energy Infrastructure, the latest twelve months Free Cash Flow is negative at about $191 Million, reflecting heavy investment and build out. Analysts expect this to turn positive from 2027, with projected Free Cash Flow of roughly $163 Million that year and about $517 Million by 2028, all in $. Beyond the analyst horizon, Simply Wall St extrapolates the trend, with modeled Free Cash Flow reaching around $3.3 Billion in 2035 as large projects ramp up and mature.
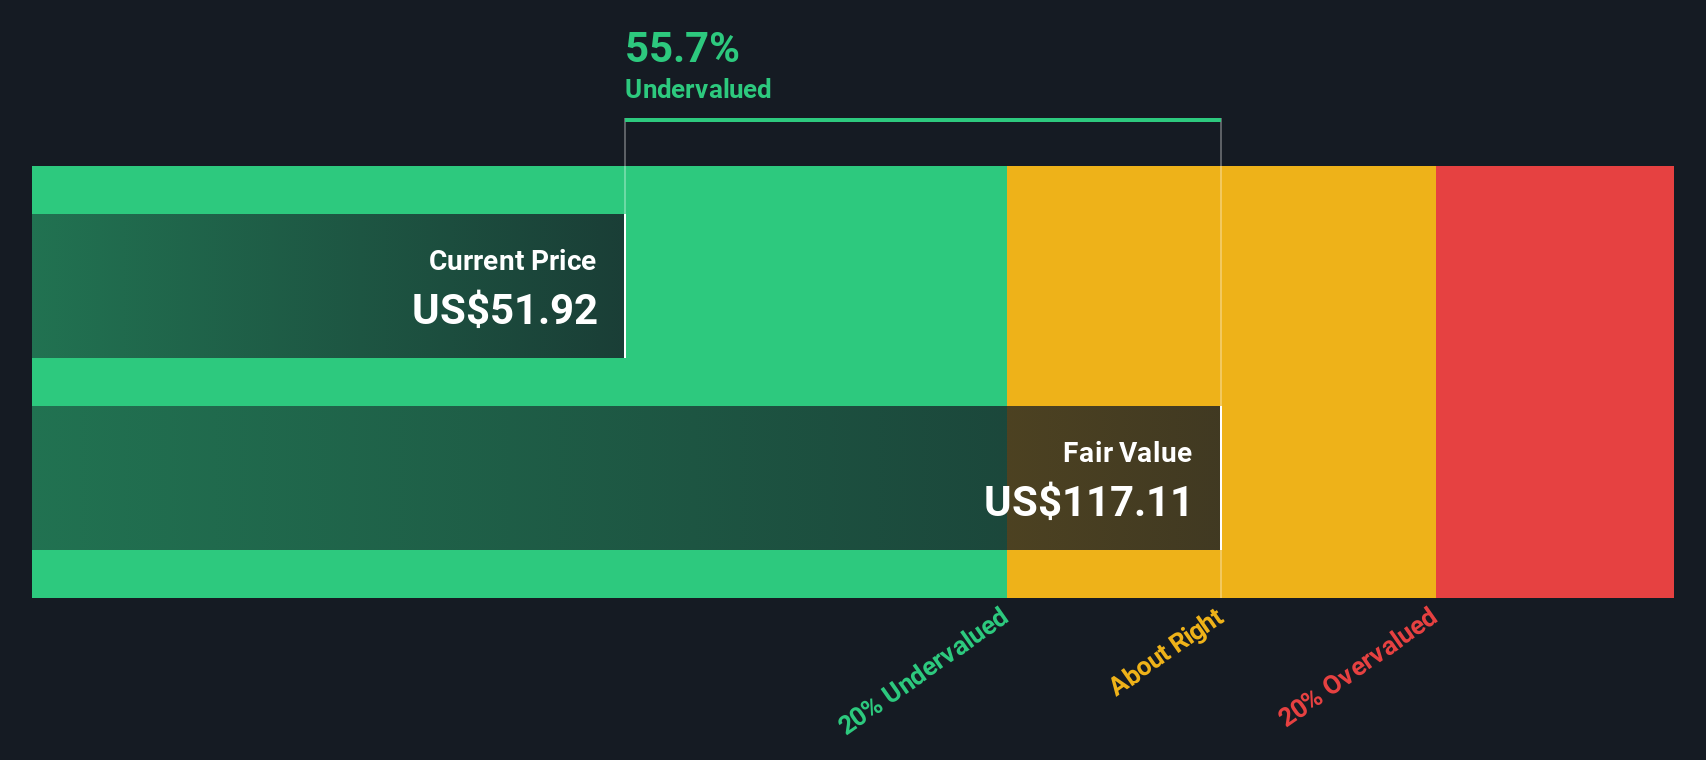
Aggregating and discounting these cash flows using a 2 Stage Free Cash Flow to Equity model produces an intrinsic value estimate of about $739.73 per share. Compared with the current share price near $55, the DCF implies the stock is trading at about a 92.5% discount, indicating that investors may currently be paying significantly less than the modeled long term cash generation suggests.
Result: UNDERVALUED
Our Discounted Cash Flow (DCF) analysis suggests Solaris Energy Infrastructure is undervalued by 92.5%. Track this in your watchlist or portfolio, or discover 908 more undervalued stocks based on cash flows.
Approach 2: Solaris Energy Infrastructure Price vs Earnings
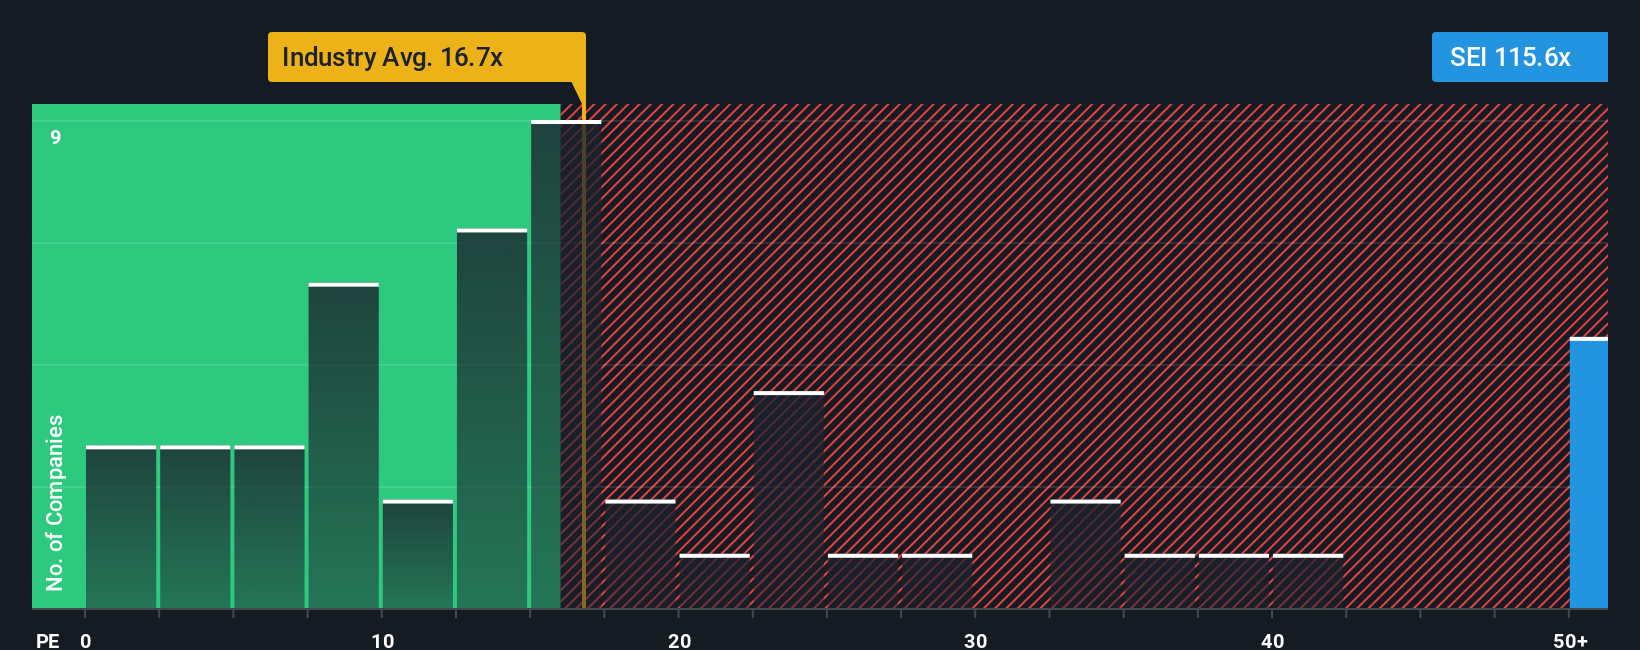
For profitable companies like Solaris Energy Infrastructure, the Price to Earnings, or PE, ratio is a useful way to gauge how much investors are willing to pay today for each dollar of current earnings. What counts as a normal or fair PE depends heavily on how fast earnings are expected to grow and how risky those earnings are. Faster growth and lower perceived risk usually justify a higher PE, while slower or more volatile earnings should trade on a lower multiple.
Solaris currently trades on a PE of about 74.1x, which is well above the Energy Services industry average of roughly 18.0x and above the peer group average of around 25.7x. Simply Wall St also calculates a proprietary Fair Ratio of about 25.6x, which estimates the PE Solaris should trade on after accounting for its specific growth outlook, profitability, risk profile, industry and size. This makes it more tailored than a simple comparison with peers or the wider industry, which may not share the same fundamentals or risk. Set against this Fair Ratio, Solaris’s current PE looks stretched, suggesting the market is paying a big premium to already optimistic expectations.
Result: OVERVALUED
PE ratios tell one story, but what if the real opportunity lies elsewhere? Discover 1442 companies where insiders are betting big on explosive growth.
Upgrade Your Decision Making: Choose your Solaris Energy Infrastructure Narrative
Earlier we mentioned that there is an even better way to understand valuation, so let's introduce you to Narratives, a simple way for you to attach a clear story about Solaris Energy Infrastructure to the numbers you believe in, like its future revenue, earnings, margins and ultimate fair value.
A Narrative on Simply Wall St links three things together: your view of the company’s story, the financial forecast that flows from that story, and the fair value that drops out of those assumptions, all in one place on the Community page used by millions of investors.
Once you have a Narrative, the platform compares your Fair Value to the current share price so you can quickly decide whether Solaris looks like a buy, hold, or sell. It then keeps that Narrative updated for you as new information, such as earnings results, contract wins or regulatory news, comes in.
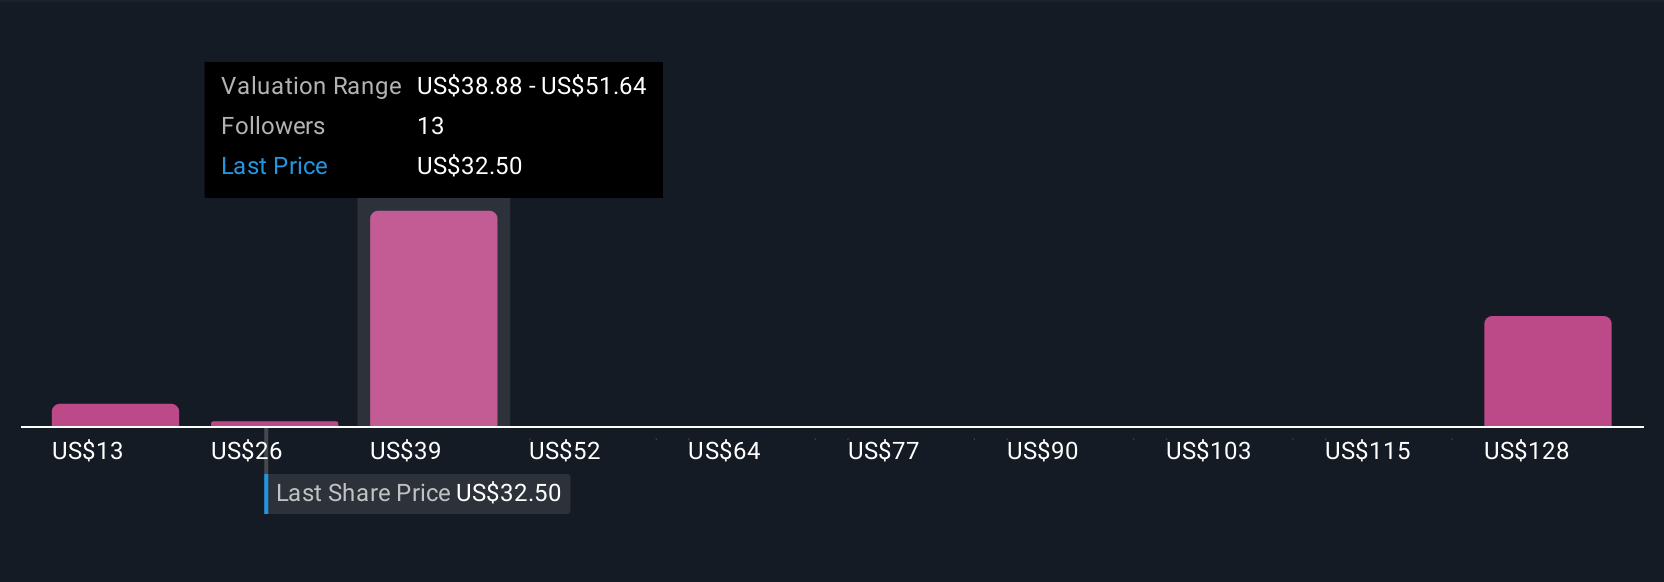
For example, one investor might build a bullish Solaris Narrative around rapid capacity expansion and assign a fair value near the high end of recent targets. A more cautious investor could focus on execution, contract and regulatory risks to justify a fair value closer to the low end, and both perspectives are visible side by side on the platform.
Do you think there's more to the story for Solaris Energy Infrastructure? Head over to our Community to see what others are saying!
This article by Simply Wall St is general in nature. We provide commentary based on historical data and analyst forecasts only using an unbiased methodology and our articles are not intended to be financial advice. It does not constitute a recommendation to buy or sell any stock, and does not take account of your objectives, or your financial situation. We aim to bring you long-term focused analysis driven by fundamental data. Note that our analysis may not factor in the latest price-sensitive company announcements or qualitative material. Simply Wall St has no position in any stocks mentioned.
Have feedback on this article? Concerned about the content? Get in touch with us directly. Alternatively, email editorial-team@simplywallst.com