
- LIVE QUOTES
- LEARN
- HELP
 Nasdaq
 Wall Street Journal
EN
Is G-III Apparel Group Fairly Priced After Mixed Signals from DCF and Earnings Multiples?
- Wondering if G-III Apparel Group is a bargain or a value trap at around $29 a share? You are not alone. This stock often flies under the radar despite some big moves in its past.
- Recently the ride has been a bit choppy, with the stock roughly flat over the last week at -0.1%, up 9.4% over the past month, but still down -8.0% year to date and -5.1% over the last year, even after a strong 108.9% gain over three years and 24.8% over five.
- That back and forth tracks with shifting sentiment around the broader apparel and retail space, as investors constantly reassess how brands will hold up in a slower spending environment. At the same time, developments around brand licensing strategies and evolving wholesale relationships have kept G-III in the conversation for investors looking for resilience and optionality in fashion names.
- On our framework G-III Apparel Group scores a 2 out of 6 on key undervaluation checks. This is mixed enough that we need to dig deeper into different valuation methods. Later on, we will look at a more holistic way to judge whether the current price truly reflects the company’s long term story.
G-III Apparel Group scores just 2/6 on our valuation checks. See what other red flags we found in the full valuation breakdown.
Approach 1: G-III Apparel Group Discounted Cash Flow (DCF) Analysis
A Discounted Cash Flow model estimates what a business is worth today by projecting the cash it could generate in the future and then discounting those cash flows back to the present.
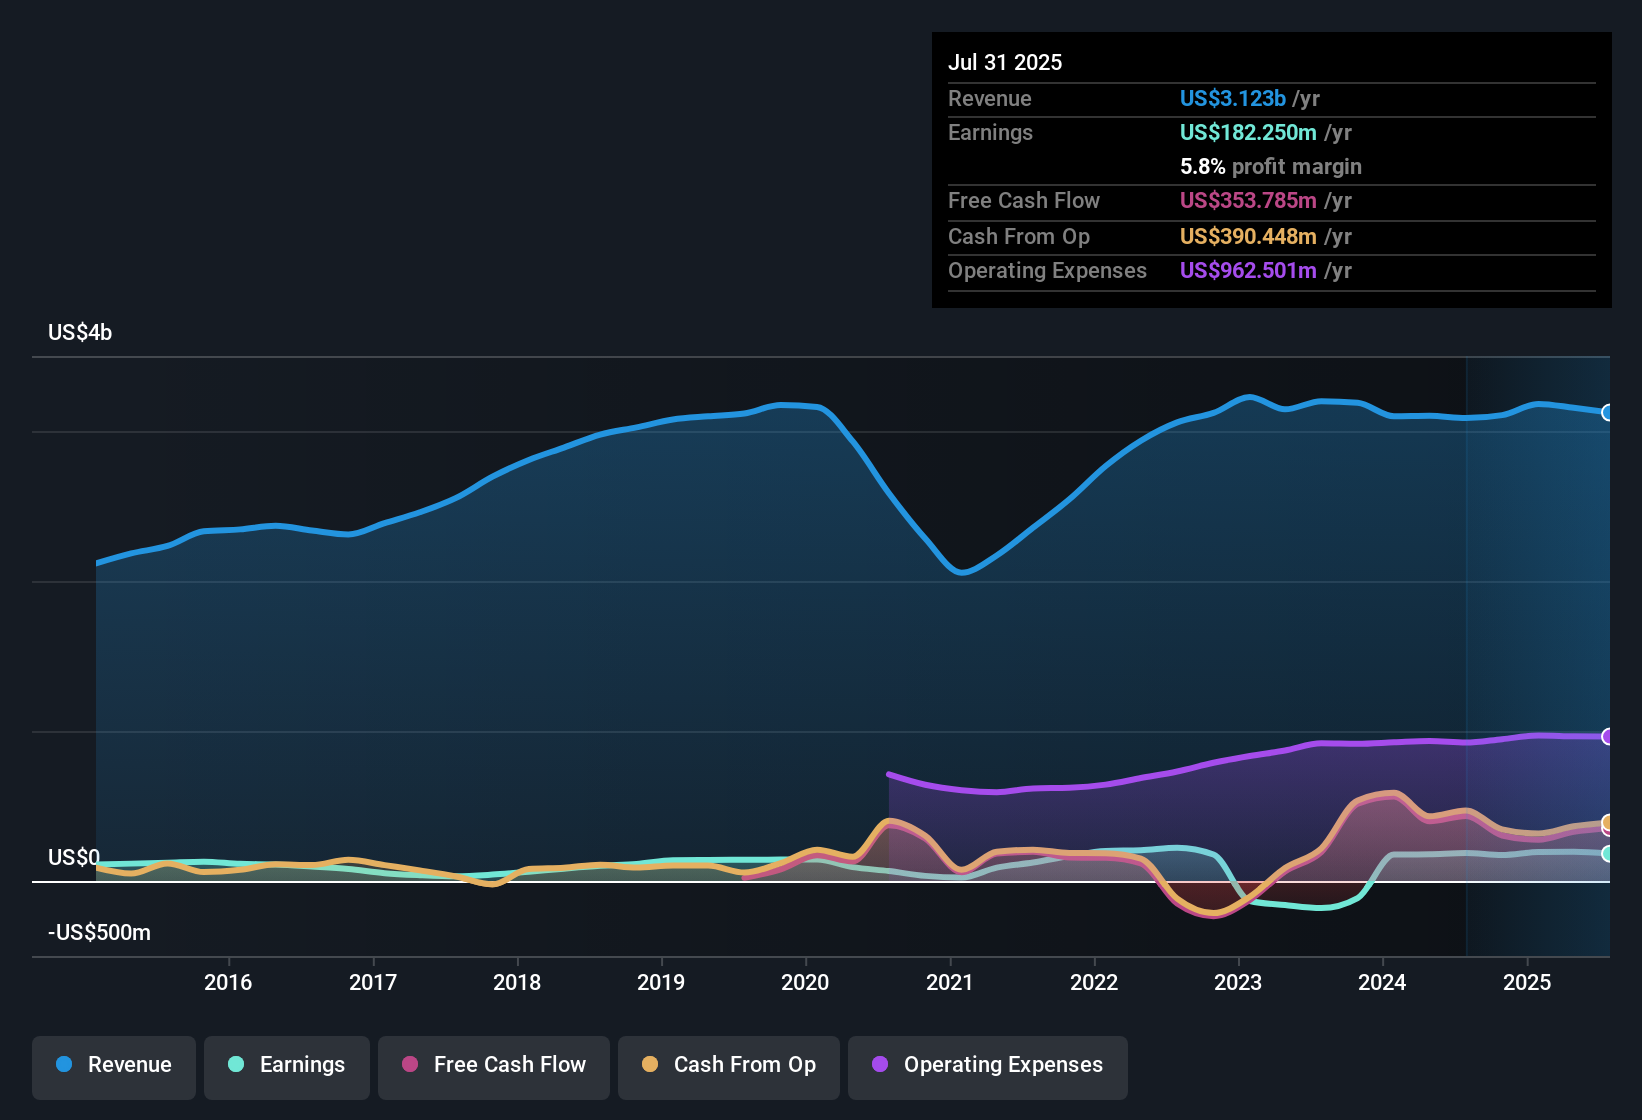
For G-III Apparel Group, the model starts with last twelve month Free Cash Flow of about $358 million and uses analyst and extrapolated forecasts to map cash flows over the next decade. Analysts see FCF of roughly $167 million in 2026 and $85.9 million in 2027, with Simply Wall St extending the trend so that by 2035 projected FCF moderates to around $31 million.
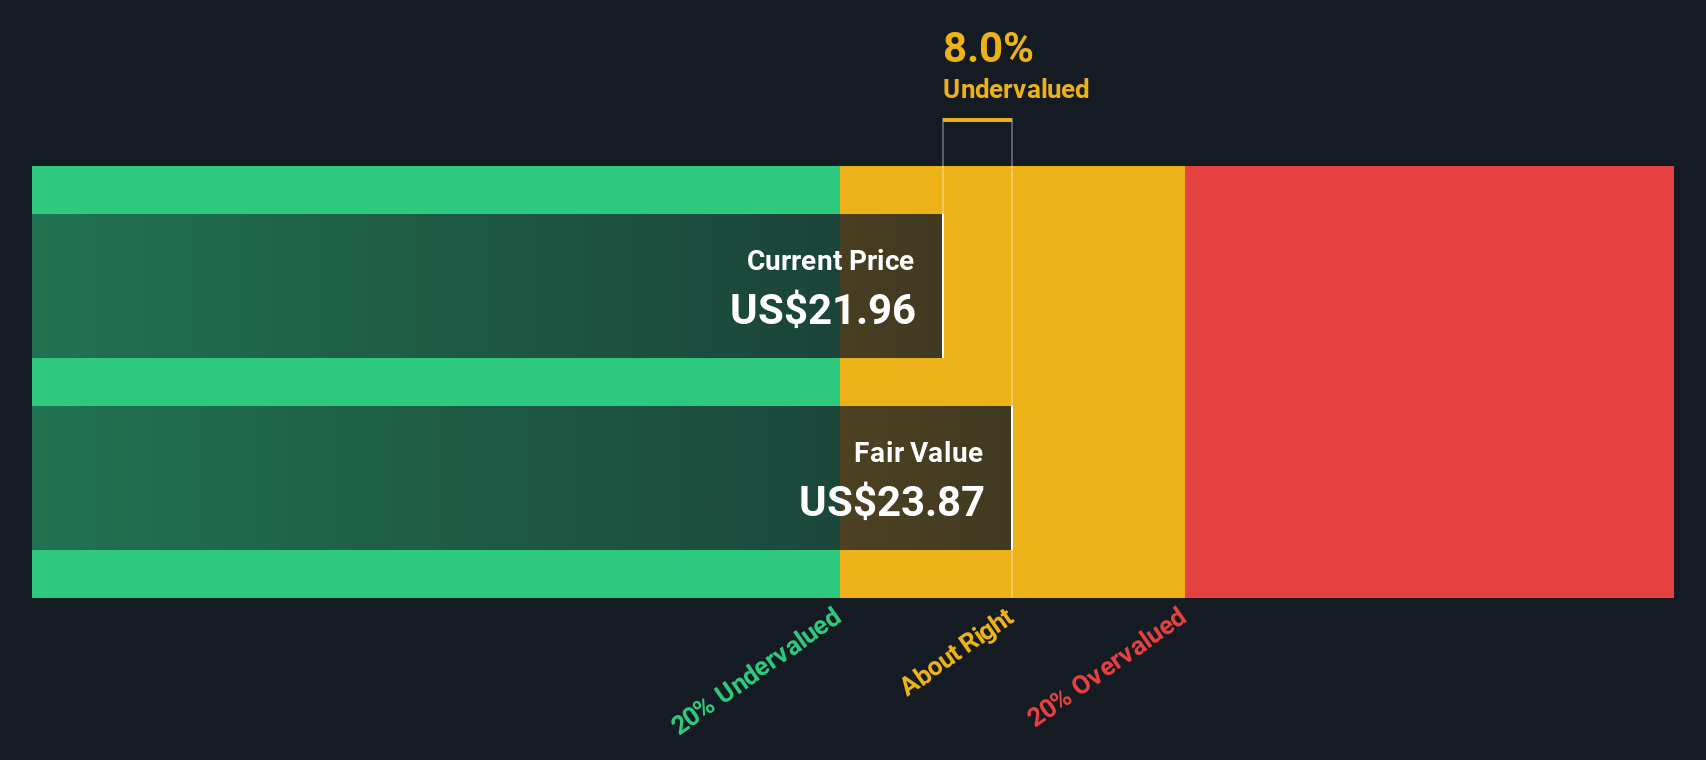
When all those projected cash flows are discounted back using a 2 Stage Free Cash Flow to Equity approach, the intrinsic value comes out at roughly $14.84 per share. Compared with a market price around $29, the DCF implies the stock is about 98.5% overvalued on this framework, indicating that investors may be paying significantly more than the value suggested by the modeled cash flows.
Result: OVERVALUED
Our Discounted Cash Flow (DCF) analysis suggests G-III Apparel Group may be overvalued by 98.5%. Discover 912 undervalued stocks or create your own screener to find better value opportunities.
Approach 2: G-III Apparel Group Price vs Earnings
For a consistently profitable business like G-III Apparel Group, the price to earnings, or PE, ratio is a useful way to judge valuation because it links what investors pay today directly to the earnings the company is generating right now.
In general, faster growing and lower risk companies tend to justify higher PE ratios, while slower growth or higher uncertainty pulls a fair PE lower. So context is everything when deciding whether a given multiple looks stretched or attractive.
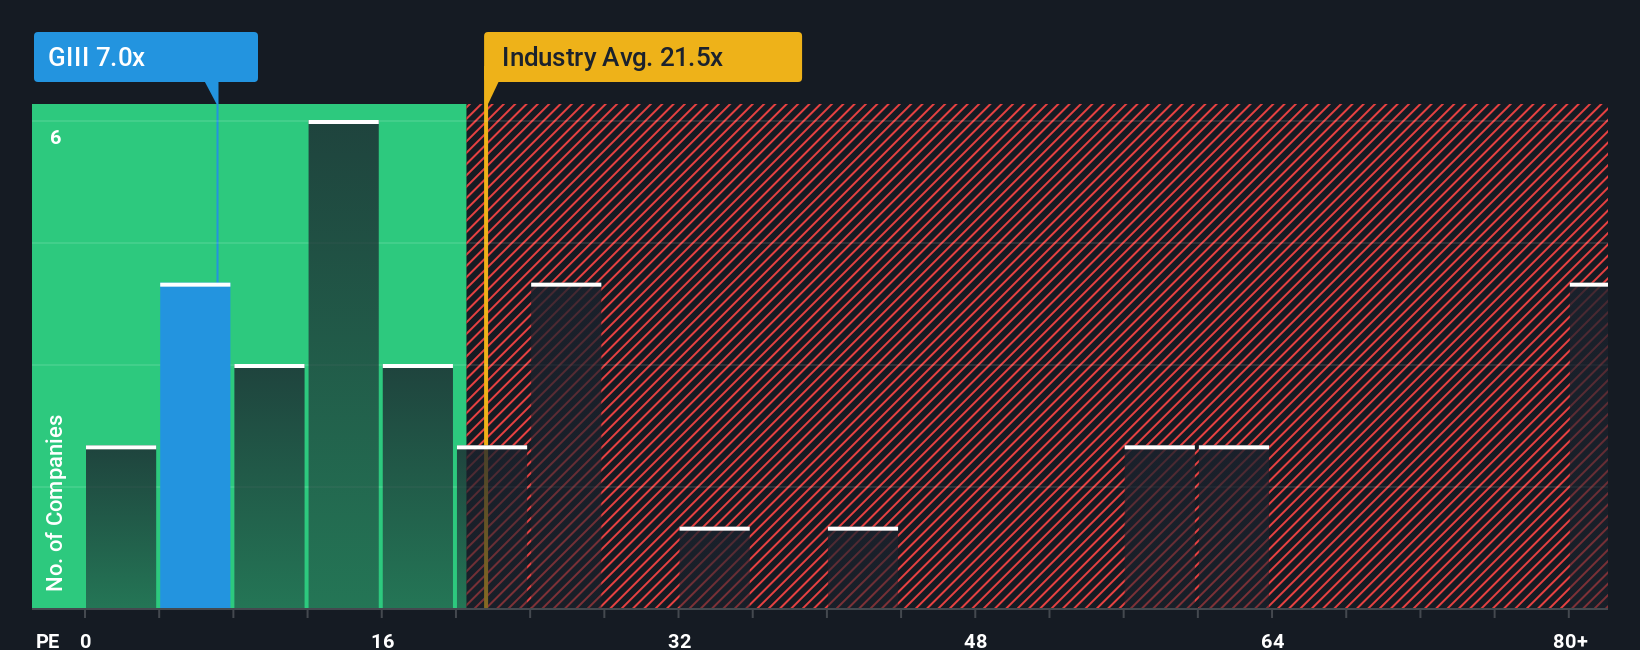
G-III currently trades on a PE of about 6.8x, which is far below the Luxury industry average of roughly 21.0x and also well under the broader peer group sitting near 35.7x. On those simple comparisons, the stock looks inexpensive. Simply Wall St goes a step further with a proprietary “Fair Ratio”, which estimates what PE investors might reasonably pay given G-III’s earnings growth outlook, profitability, size, industry and risk profile, rather than just copying what peers trade at.
Because that Fair Ratio still sits meaningfully above today’s 6.8x, this framework points to the shares being undervalued on an earnings basis.
Result: UNDERVALUED
PE ratios tell one story, but what if the real opportunity lies elsewhere? Discover 1442 companies where insiders are betting big on explosive growth.
Upgrade Your Decision Making: Choose your G-III Apparel Group Narrative
Earlier we mentioned that there is an even better way to understand valuation, so let us introduce you to Narratives, a simple way to combine your view of G-III Apparel Group’s future with a clear, numbers based forecast and fair value.
A Narrative is your story about the company, translated into assumptions for future revenue, earnings and margins, which then flow through to a forecast and an estimated fair value per share.
On Simply Wall St’s Community page, millions of investors use Narratives as an easy, guided tool, helping them compare their fair value estimate for G-III with the current price.
Because Narratives update dynamically when new information like earnings releases, license changes or macro news arrives, your story and valuation can evolve as the facts change, without needing to rebuild a model from scratch.
For example, one G-III Narrative might lean optimistic and see fair value closer to $36 based on expectations for stronger performance of owned brands and margin expansion. A more cautious Narrative could sit near $27, reflecting concern about lost licenses and execution risks. The difference between each Narrative and today’s share price may support very different conclusions for those investors.
Do you think there's more to the story for G-III Apparel Group? Head over to our Community to see what others are saying!
This article by Simply Wall St is general in nature. We provide commentary based on historical data and analyst forecasts only using an unbiased methodology and our articles are not intended to be financial advice. It does not constitute a recommendation to buy or sell any stock, and does not take account of your objectives, or your financial situation. We aim to bring you long-term focused analysis driven by fundamental data. Note that our analysis may not factor in the latest price-sensitive company announcements or qualitative material. Simply Wall St has no position in any stocks mentioned.
Have feedback on this article? Concerned about the content? Get in touch with us directly. Alternatively, email editorial-team@simplywallst.com