
- LIVE QUOTES
- LEARN
- HELP
 Nasdaq
 Wall Street Journal
EN
IsoEnergy Ltd.'s (TSE:ISO) largest shareholders are retail investors who were rewarded as market cap surged CA$83m last week
Key Insights
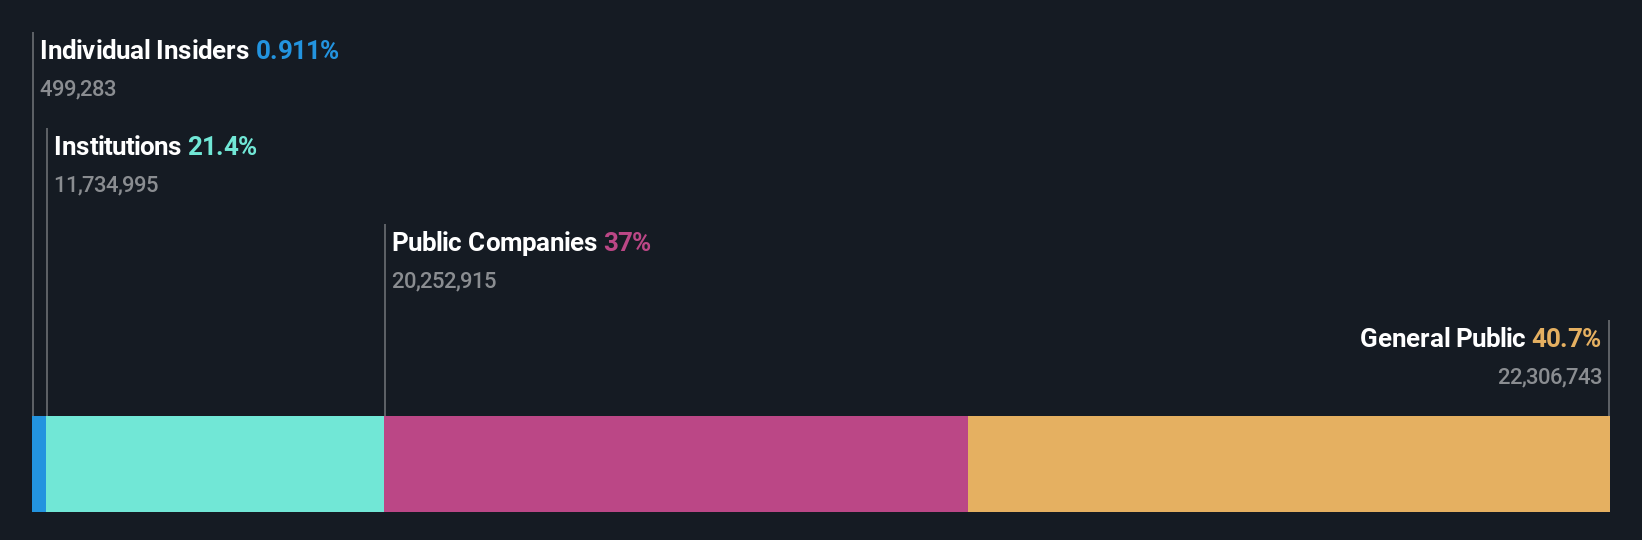
- IsoEnergy's significant retail investors ownership suggests that the key decisions are influenced by shareholders from the larger public
- A total of 5 investors have a majority stake in the company with 50% ownership
- Insiders have sold recently
A look at the shareholders of IsoEnergy Ltd. (TSE:ISO) can tell us which group is most powerful. With 41% stake, retail investors possess the maximum shares in the company. That is, the group stands to benefit the most if the stock rises (or lose the most if there is a downturn).
Clearly, retail investors benefitted the most after the company's market cap rose by CA$83m last week.
Let's take a closer look to see what the different types of shareholders can tell us about IsoEnergy.
See our latest analysis for IsoEnergy
What Does The Institutional Ownership Tell Us About IsoEnergy?
Many institutions measure their performance against an index that approximates the local market. So they usually pay more attention to companies that are included in major indices.
IsoEnergy already has institutions on the share registry. Indeed, they own a respectable stake in the company. This can indicate that the company has a certain degree of credibility in the investment community. However, it is best to be wary of relying on the supposed validation that comes with institutional investors. They too, get it wrong sometimes. It is not uncommon to see a big share price drop if two large institutional investors try to sell out of a stock at the same time. So it is worth checking the past earnings trajectory of IsoEnergy, (below). Of course, keep in mind that there are other factors to consider, too.

Hedge funds don't have many shares in IsoEnergy. NexGen Energy Ltd. is currently the largest shareholder, with 30% of shares outstanding. ALPS Advisors, Inc. is the second largest shareholder owning 9.3% of common stock, and Queen's Road Capital Investment Ltd. holds about 5.0% of the company stock.
To make our study more interesting, we found that the top 5 shareholders control more than half of the company which implies that this group has considerable sway over the company's decision-making.
While it makes sense to study institutional ownership data for a company, it also makes sense to study analyst sentiments to know which way the wind is blowing. There are plenty of analysts covering the stock, so it might be worth seeing what they are forecasting, too.
Insider Ownership Of IsoEnergy
The definition of company insiders can be subjective and does vary between jurisdictions. Our data reflects individual insiders, capturing board members at the very least. Management ultimately answers to the board. However, it is not uncommon for managers to be executive board members, especially if they are a founder or the CEO.
Insider ownership is positive when it signals leadership are thinking like the true owners of the company. However, high insider ownership can also give immense power to a small group within the company. This can be negative in some circumstances.
Our data suggests that insiders own under 1% of IsoEnergy Ltd. in their own names. It has a market capitalization of just CA$742m, and the board has only CA$6.8m worth of shares in their own names. Many tend to prefer to see a board with bigger shareholdings. A good next step might be to take a look at this free summary of insider buying and selling.
General Public Ownership
The general public-- including retail investors -- own 41% stake in the company, and hence can't easily be ignored. This size of ownership, while considerable, may not be enough to change company policy if the decision is not in sync with other large shareholders.
Public Company Ownership
Public companies currently own 37% of IsoEnergy stock. It's hard to say for sure but this suggests they have entwined business interests. This might be a strategic stake, so it's worth watching this space for changes in ownership.
Next Steps:
I find it very interesting to look at who exactly owns a company. But to truly gain insight, we need to consider other information, too. To that end, you should learn about the 4 warning signs we've spotted with IsoEnergy (including 1 which makes us a bit uncomfortable) .
But ultimately it is the future, not the past, that will determine how well the owners of this business will do. Therefore we think it advisable to take a look at this free report showing whether analysts are predicting a brighter future.
NB: Figures in this article are calculated using data from the last twelve months, which refer to the 12-month period ending on the last date of the month the financial statement is dated. This may not be consistent with full year annual report figures.
Have feedback on this article? Concerned about the content? Get in touch with us directly. Alternatively, email editorial-team (at) simplywallst.com.
This article by Simply Wall St is general in nature. We provide commentary based on historical data and analyst forecasts only using an unbiased methodology and our articles are not intended to be financial advice. It does not constitute a recommendation to buy or sell any stock, and does not take account of your objectives, or your financial situation. We aim to bring you long-term focused analysis driven by fundamental data. Note that our analysis may not factor in the latest price-sensitive company announcements or qualitative material. Simply Wall St has no position in any stocks mentioned.