
- LIVE QUOTES
- LEARN
- HELP
 Nasdaq
 Wall Street Journal
EN
Does LexinFintech Still Offer Value After a 44% Slide in 2025?
- Wondering if LexinFintech Holdings at around $3.24 is a bargain or a value trap? This breakdown will help you decide whether the current price makes sense or not.
- The stock has been volatile, dropping about 1.5% over the last week, 26.0% over the past month, and 43.8% year to date, although it is still up roughly 88.9% over three years despite being down 39.4% over the last year.
- Recent trading has been shaped by shifting sentiment around Chinese fintech regulation and investor appetite for higher risk consumer lenders, with Lexin often moving alongside broader Chinese tech and ADR names. At the same time, the company has been trying to reposition itself with more diversified financial services partnerships and technology driven credit solutions. This helps explain some of the volatility as the market reassesses its long term prospects.
- On our valuation framework, LexinFintech scores a solid 5 out of 6 for being undervalued. Next we will unpack what that means across different valuation approaches, before finishing with a more intuitive way to think about what the stock might really be worth.
Find out why LexinFintech Holdings's -39.4% return over the last year is lagging behind its peers.
Approach 1: LexinFintech Holdings Excess Returns Analysis
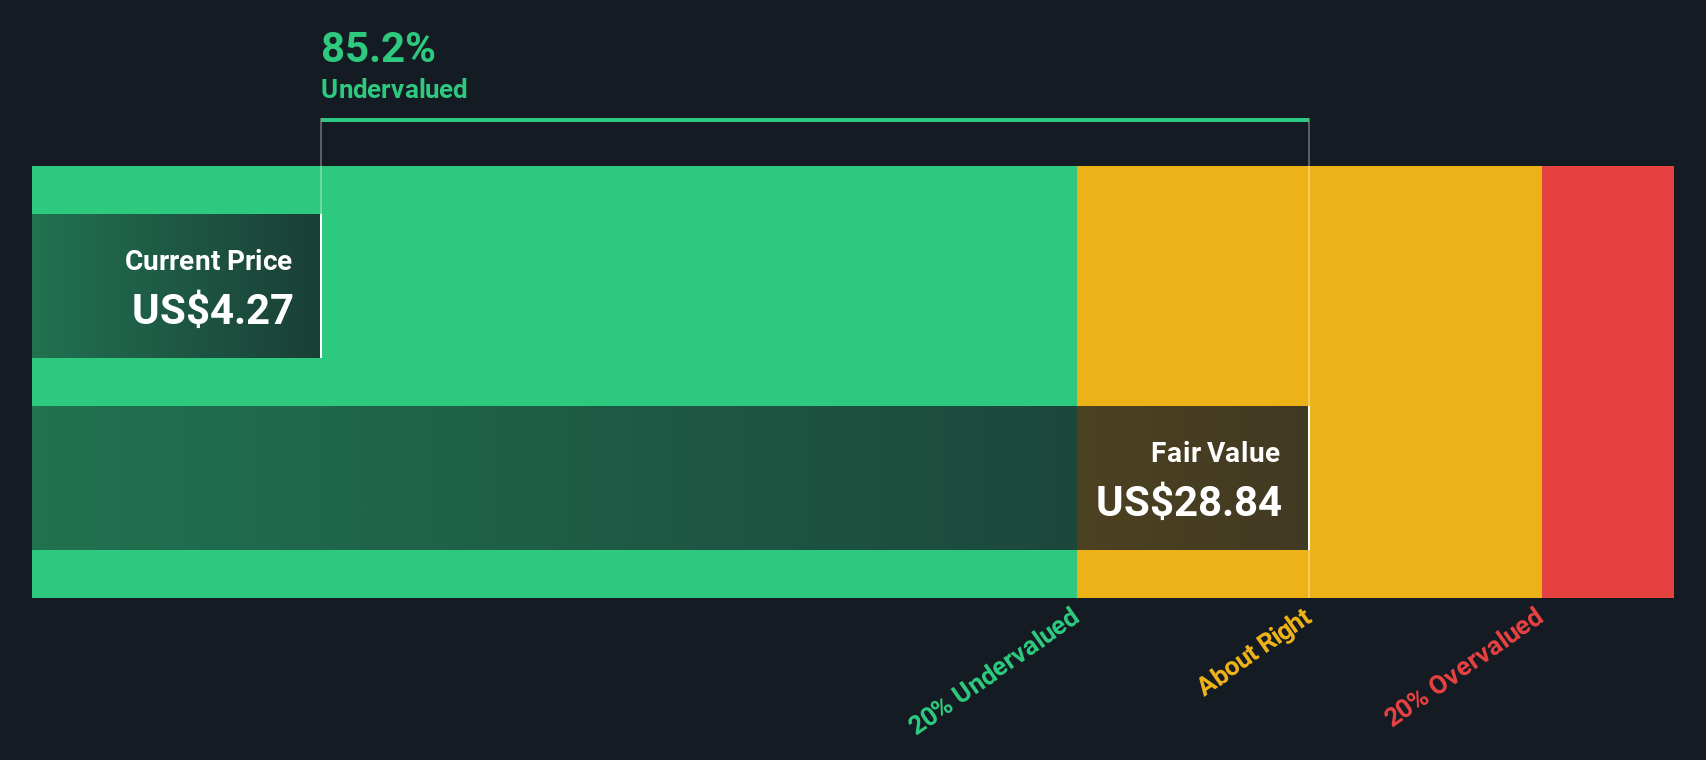
The Excess Returns model estimates what shareholders earn over and above the minimum return they require for taking equity risk, then capitalizes those excess profits into an intrinsic value per share.
For LexinFintech Holdings, the model starts with a Book Value of $69.36 per share and a Stable EPS of $12.64 per share, based on weighted future Return on Equity estimates from 4 analysts. With an Average Return on Equity of 16.15% and a Stable Book Value projected to rise to $78.27 per share, the business is expected to keep generating attractive profits on its equity base.
The required Cost of Equity is $9.13 per share, so the Excess Return comes out at $3.51 per share. By projecting these excess returns forward and discounting them, the model arrives at an intrinsic value of roughly $16.97 per share.
Against a current share price near $3.24, this implies the stock is about 80.9% undervalued using this approach, signaling a wide margin of safety if the assumptions hold.
Result: UNDERVALUED
Our Excess Returns analysis suggests LexinFintech Holdings is undervalued by 80.9%. Track this in your watchlist or portfolio, or discover 912 more undervalued stocks based on cash flows.
Approach 2: LexinFintech Holdings Price vs Earnings
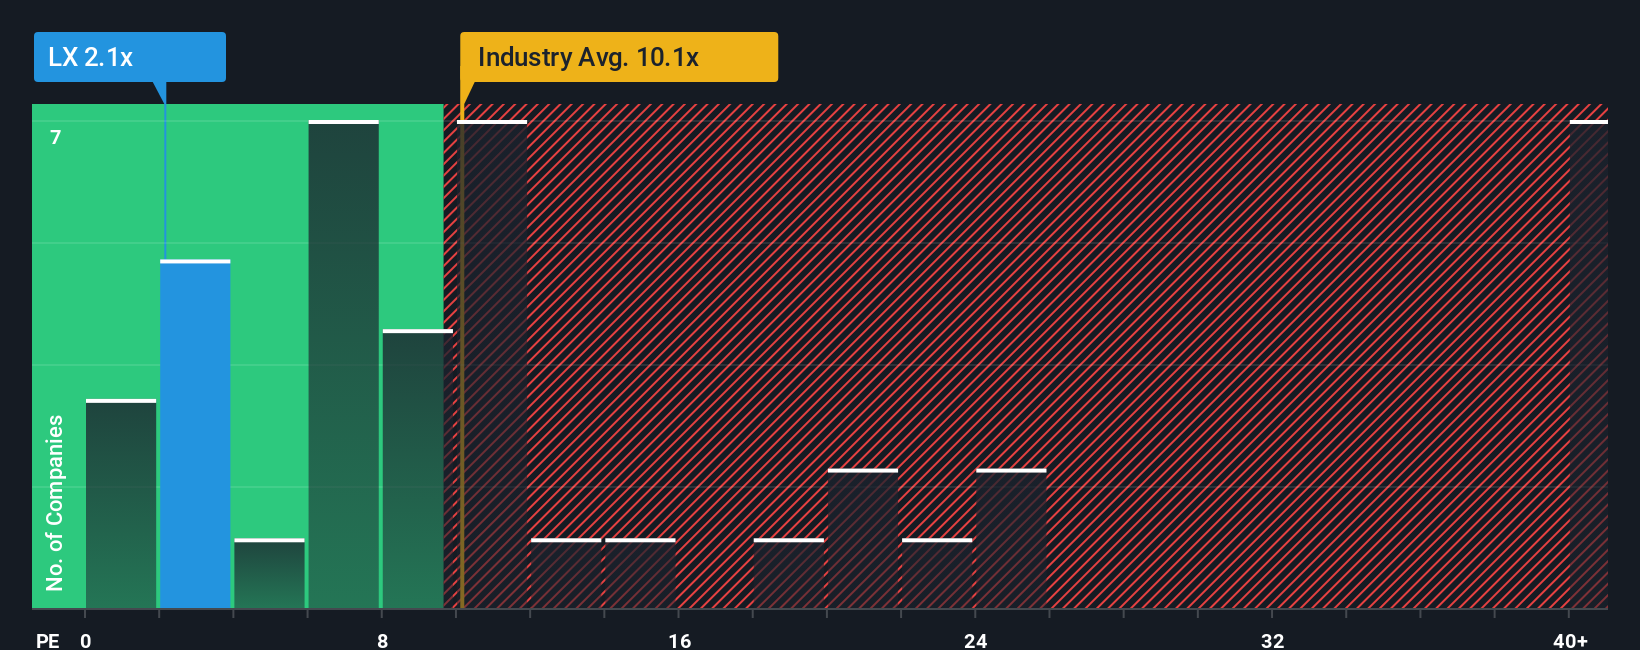
For a profitable business like LexinFintech, the Price to Earnings (PE) ratio is a useful yardstick because it links what investors pay today to the earnings the company is already generating. In general, companies with stronger growth prospects and lower perceived risk tend to justify higher PE ratios, while slower growth or higher risk usually warrants a lower multiple.
LexinFintech currently trades on a PE of about 2.1x, which is dramatically below both the Consumer Finance industry average of roughly 10.1x and the broader peer group average of around 18.7x. Simply Wall St also calculates a Fair Ratio of about 19.1x for LexinFintech, which reflects the PE the company might reasonably trade at given its earnings growth profile, margins, industry positioning, market cap and specific risk factors.
This Fair Ratio is more informative than a simple comparison with peers or the industry because it explicitly adjusts for company specific strengths and weaknesses rather than assuming all lenders deserve the same multiple. Compared to the current PE of 2.1x, the Fair Ratio of 19.1x indicates that the market is pricing LexinFintech at a steep discount to what its fundamentals would typically warrant.
Result: UNDERVALUED
PE ratios tell one story, but what if the real opportunity lies elsewhere? Discover 1440 companies where insiders are betting big on explosive growth.
Upgrade Your Decision Making: Choose your LexinFintech Holdings Narrative
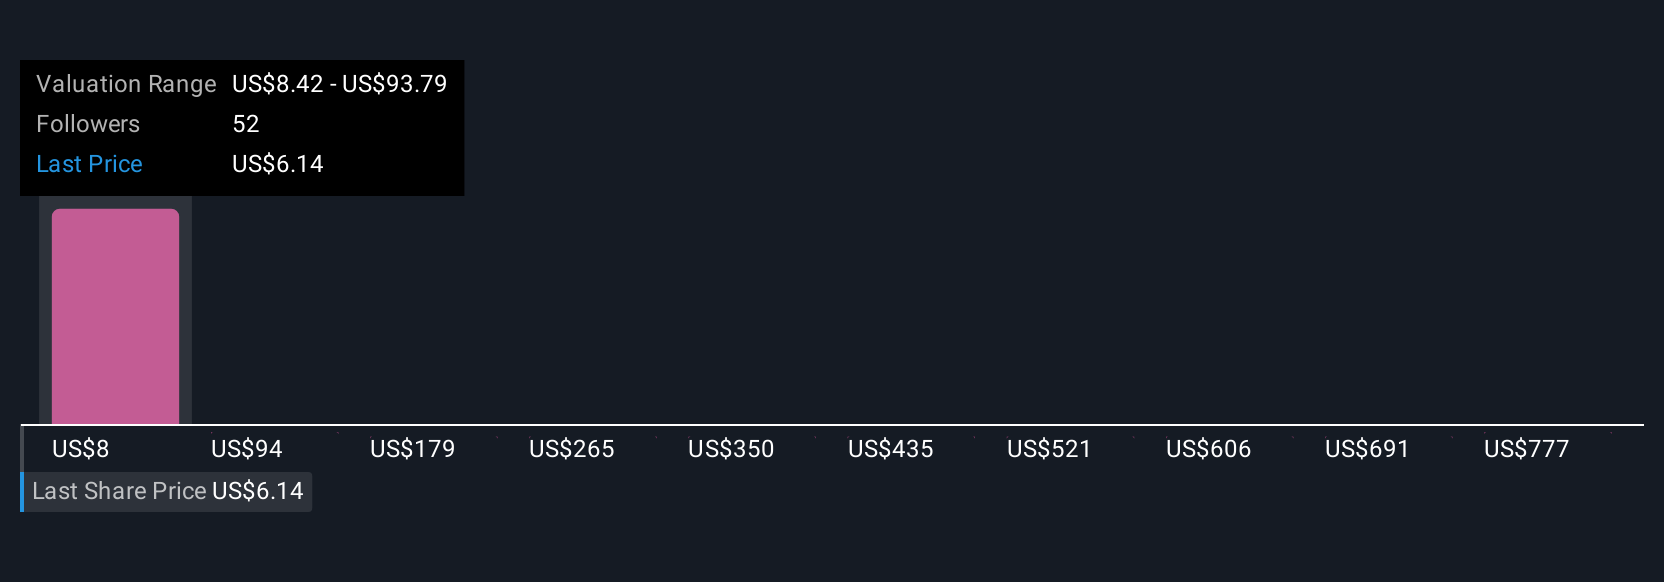
Earlier we mentioned that there is an even better way to understand valuation, so let us introduce you to Narratives. These are simple stories that capture your view of a company and tie that story to assumptions about its future revenue, earnings, margins and ultimately what you think is a fair value today.
A Narrative links three things together in one place: the business story you believe, the financial forecast that flows from that story, and the fair value those numbers imply. This helps you see clearly how your expectations translate into a buy, hold or sell decision.
On Simply Wall St, Narratives sit inside the Community page as an easy to use tool available to millions of investors. They help you compare your own Fair Value with the current share price to decide whether LexinFintech looks attractively priced or expensive, and they automatically update when new information such as earnings releases, regulatory changes or major news is added to the platform.
For example, one LexinFintech Narrative might lean bullish and land near the higher end of recent fair value views around $14.19. A more cautious Narrative could sit closer to the lower end near $4.79, showing how two investors using the same facts can arrive at very different but clearly articulated positions.
Do you think there's more to the story for LexinFintech Holdings? Head over to our Community to see what others are saying!
This article by Simply Wall St is general in nature. We provide commentary based on historical data and analyst forecasts only using an unbiased methodology and our articles are not intended to be financial advice. It does not constitute a recommendation to buy or sell any stock, and does not take account of your objectives, or your financial situation. We aim to bring you long-term focused analysis driven by fundamental data. Note that our analysis may not factor in the latest price-sensitive company announcements or qualitative material. Simply Wall St has no position in any stocks mentioned.
Have feedback on this article? Concerned about the content? Get in touch with us directly. Alternatively, email editorial-team@simplywallst.com