
- LIVE QUOTES
- LEARN
- HELP
 Nasdaq
 Wall Street Journal
EN
Has Mitsui Kinzoku’s 280% Surge in 2025 Already Priced In Future Growth?
- Wondering if Mitsui Kinzoku Company is still a smart buy after its huge run up, or if most of the upside is already in the rear view mirror? You are not alone, and that is exactly what this breakdown is here to unpack.
- The stock has pulled back about 3.8% over the last week, but it is still up 9.1% over 30 days and an eye catching 280.5% year to date, with a 275.2% gain over the past year that caps off multi year returns above 500% over three years.
- Those moves come against a backdrop of bullish sentiment toward materials and battery related names in Japan, alongside ongoing interest in companies exposed to advanced metals and energy transition supply chains. At the same time, shifting risk appetite in global markets has made investors more sensitive to valuation, making Mitsui Kinzoku’s rapid re rating a key talking point.
- Despite the strong share price performance, Mitsui Kinzoku currently scores just 1/6 on our undervaluation checks. On the surface it does not look like a classic bargain, but headline scores rarely tell the full story. Next we will walk through different valuation approaches to see what they imply for today’s price, then wrap up with a more complete way to think about valuation that goes beyond the usual multiples and models.
Mitsui Kinzoku Company scores just 1/6 on our valuation checks. See what other red flags we found in the full valuation breakdown.
Approach 1: Mitsui Kinzoku Company Discounted Cash Flow (DCF) Analysis
A Discounted Cash Flow model estimates what a business is worth by projecting the cash it can generate in the future and discounting those cash flows back to today in ¥ terms.
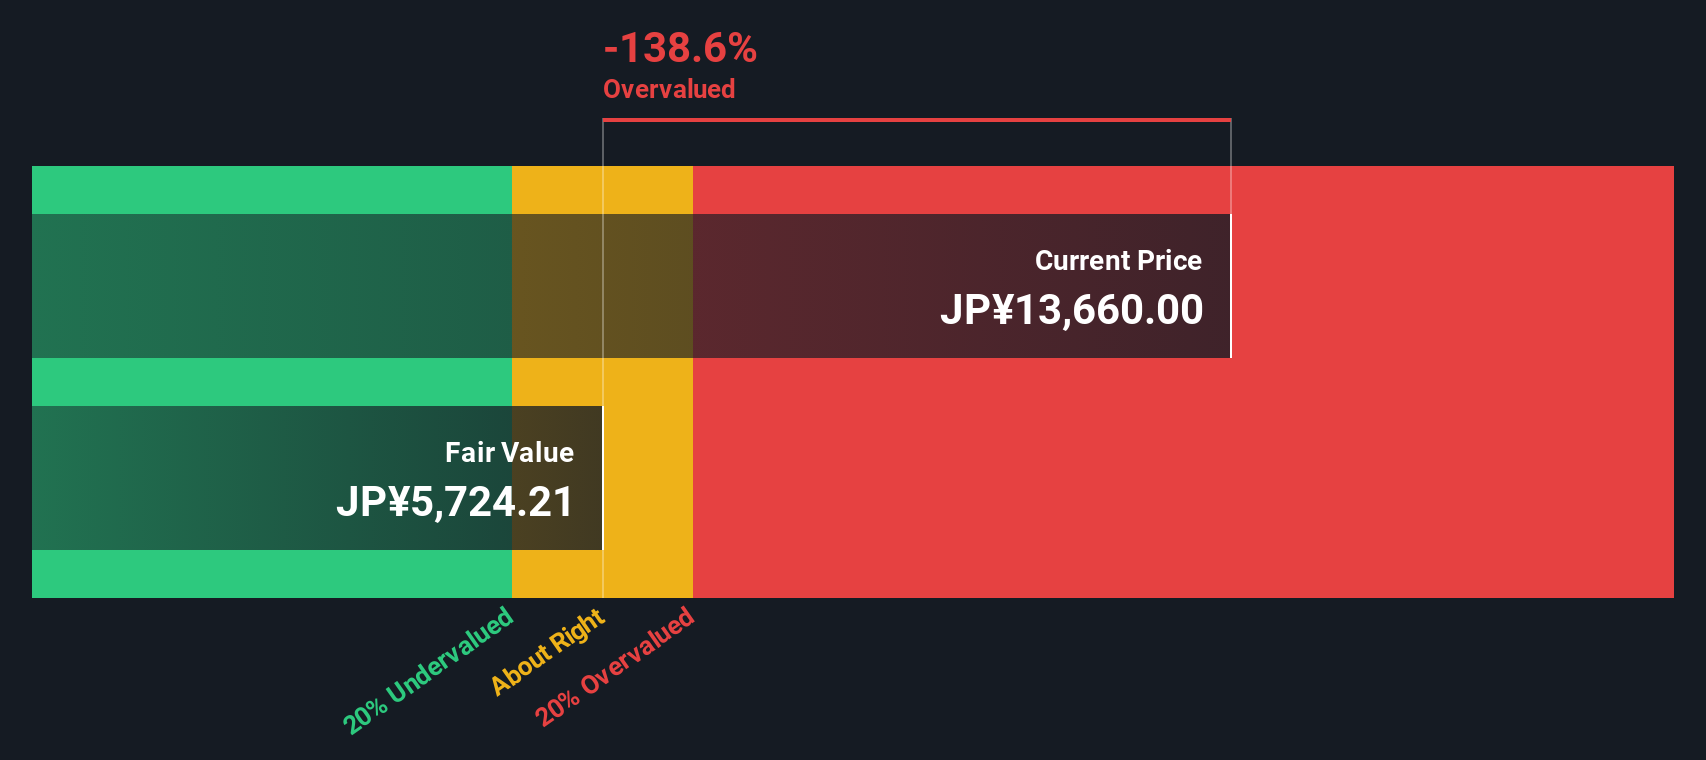
For Mitsui Kinzoku Company, the latest twelve month Free Cash Flow is about ¥35,010 million, and analysts see this staying robust over the next several years. Projections used in the 2 Stage Free Cash Flow to Equity model show Free Cash Flow rising into the mid ¥20,000 to ¥40,000 million range in coming years, before normalizing at around ¥24,300 million by 2030. Beyond the explicit analyst forecasts, Simply Wall St extrapolates additional years of cash flows to build a fuller long term picture.
When those projected cash flows are discounted back, the model estimates an intrinsic value of roughly ¥6,862 per share. Compared with the current share price, this implies the stock is about 155.4% overvalued, suggesting that a lot of future optimism is already reflected in today’s price.
Result: OVERVALUED
Our Discounted Cash Flow (DCF) analysis suggests Mitsui Kinzoku Company may be overvalued by 155.4%. Discover 907 undervalued stocks or create your own screener to find better value opportunities.
Approach 2: Mitsui Kinzoku Company Price vs Earnings
For a profitable business like Mitsui Kinzoku Company, the Price to Earnings (PE) ratio is a useful way to gauge how much investors are paying for each unit of current earnings. In general, faster and more reliable earnings growth can justify a higher PE, while higher risk or more cyclical profits usually call for a lower, more conservative multiple.
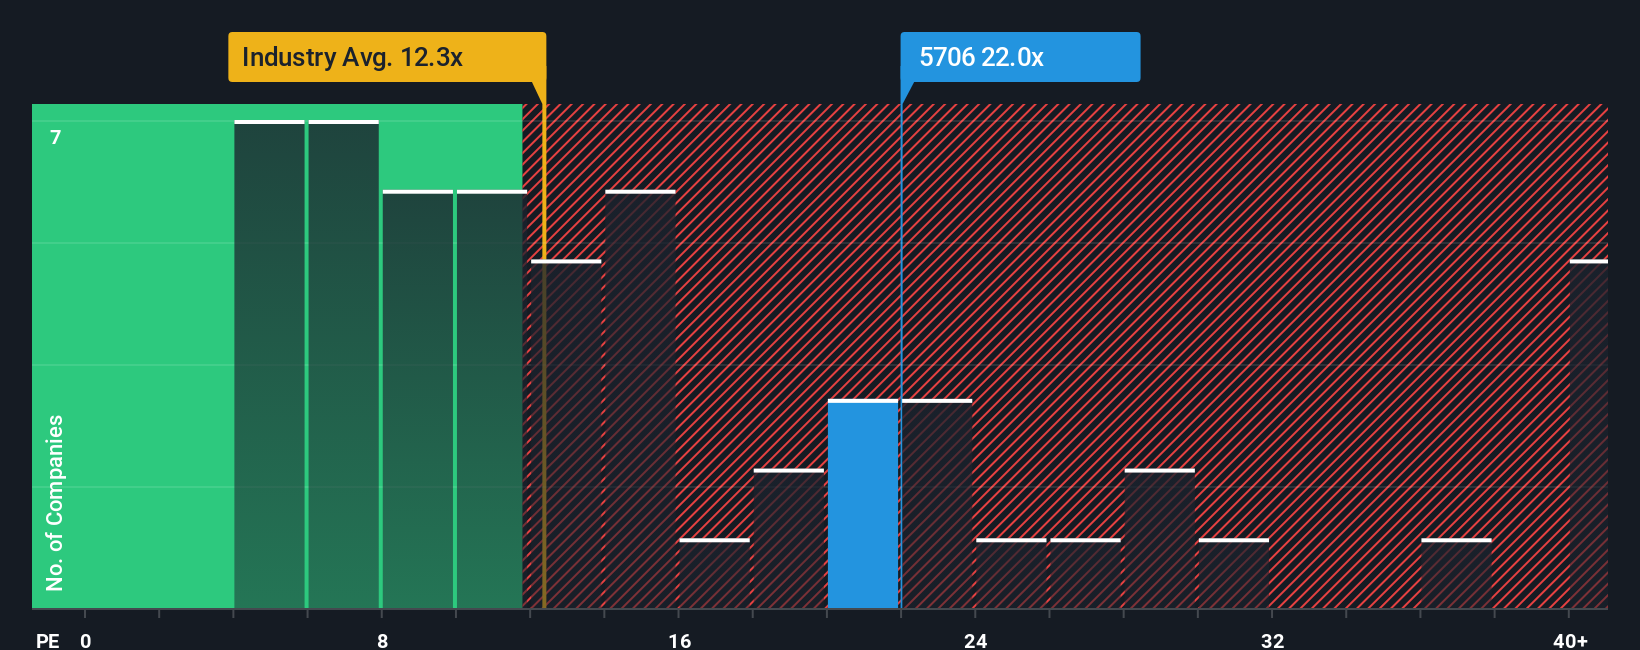
Mitsui Kinzoku currently trades on a PE of about 21.5x. That is below the average of its peer group at roughly 31.8x, but above the broader Metals and Mining industry average of around 12.2x, reflecting the market’s stronger expectations for this particular name. To refine this view, Simply Wall St uses a proprietary Fair Ratio, which estimates what a reasonable PE should be once earnings growth, profitability, risk profile, industry and market cap are all taken into account. This tends to be more informative than a simple comparison with peers, which may differ meaningfully on growth or risk.
For Mitsui Kinzoku, the Fair Ratio is estimated at about 16.7x, noticeably below the current 21.5x. This points to the shares trading ahead of what fundamentals alone would suggest.
Result: OVERVALUED
PE ratios tell one story, but what if the real opportunity lies elsewhere? Discover 1443 companies where insiders are betting big on explosive growth.
Upgrade Your Decision Making: Choose your Mitsui Kinzoku Company Narrative
Earlier we mentioned that there is an even better way to understand valuation, so let us introduce you to Narratives, a more powerful framework that connects the story you believe about a company with the numbers behind it.
A Narrative on Simply Wall St is your own investment storyline, where you spell out how you think Mitsui Kinzoku’s revenues, earnings and margins might evolve, then translate that view into an estimated fair value per share.
Instead of looking at raw ratios in isolation, a Narrative links your thesis about the business to a structured financial forecast, and then to a fair value that you can directly compare with today’s market price to help inform your decisions.
Narratives are built and shared on Simply Wall St’s Community page, used by millions of investors, and they update dynamically when new earnings, guidance or news is released, so your fair value view can evolve with the facts.
For example, one Mitsui Kinzoku Narrative might assume strong long term battery material demand and assign a high fair value, while another assumes cyclical headwinds and assigns a much lower fair value.
Do you think there's more to the story for Mitsui Kinzoku Company? Head over to our Community to see what others are saying!
This article by Simply Wall St is general in nature. We provide commentary based on historical data and analyst forecasts only using an unbiased methodology and our articles are not intended to be financial advice. It does not constitute a recommendation to buy or sell any stock, and does not take account of your objectives, or your financial situation. We aim to bring you long-term focused analysis driven by fundamental data. Note that our analysis may not factor in the latest price-sensitive company announcements or qualitative material. Simply Wall St has no position in any stocks mentioned.
Have feedback on this article? Concerned about the content? Get in touch with us directly. Alternatively, email editorial-team@simplywallst.com