
- LIVE QUOTES
- LEARN
- HELP
 Nasdaq
 Wall Street Journal
EN
Does Lenovo Still Offer Value After AI Ready PC Push And Share Price Volatility?
- Wondering if Lenovo Group is still a smart buy at today’s price, or if the market has already priced in its upside? You are not alone in asking whether the current tag matches its long term potential.
- The stock has been a bit choppy lately, up 1.4% over the last week but down 12.6% over the past month, even though it is still up 1.2% year to date, 11.2% over 1 year, 81.9% over 3 years, and 109.4% over 5 years.
- Recent headlines have focused on Lenovo’s push into AI ready PCs, expanding its infrastructure solutions, and deepening partnerships with major chipmakers. All of these initiatives are aimed at positioning the company for the next hardware and data center upgrade cycle. At the same time, investors are watching how Lenovo manages supply chains and margins as it leans further into higher value, service heavy offerings.
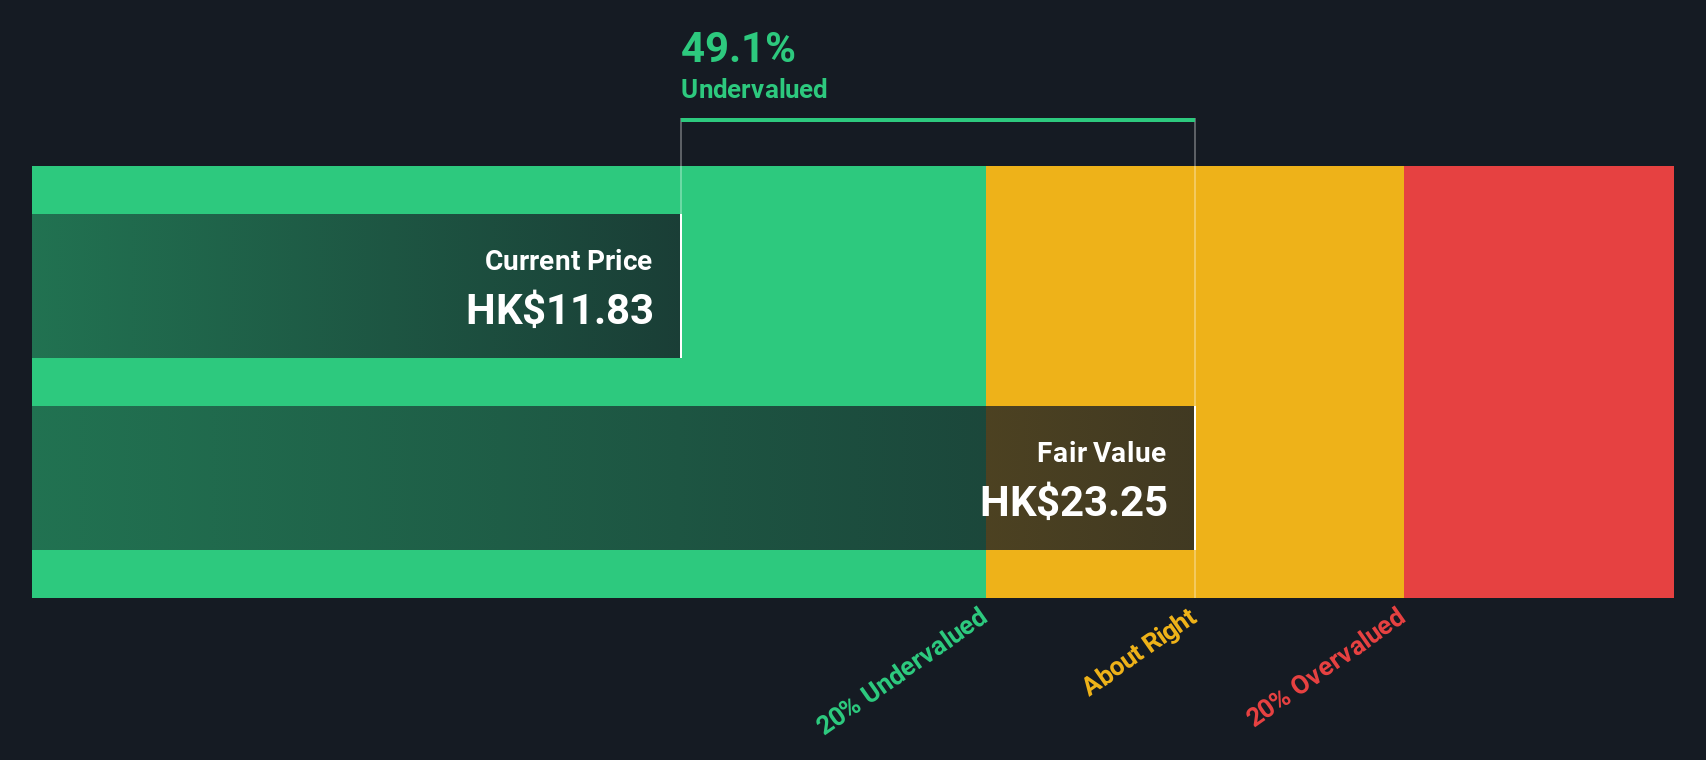
- On our checks, Lenovo scores a solid 5/6 valuation score, suggesting it looks undervalued on most of the key metrics we track. Next we will walk through those different valuation approaches, before circling back at the end to an even better way of thinking about what the stock might really be worth.
Find out why Lenovo Group's 11.2% return over the last year is lagging behind its peers.
Approach 1: Lenovo Group Discounted Cash Flow (DCF) Analysis
A Discounted Cash Flow model estimates what a business is worth by projecting its future cash flows and discounting them back to today’s value. For Lenovo Group, the model is based on a 2 Stage Free Cash Flow to Equity approach, using $486.1 million of last twelve month free cash flow as a starting point.
Analysts expect Lenovo’s free cash flow to rise to around $2.05 billion in 2026 and $2.32 billion in 2027, before reaching about $2.60 billion by 2028. Beyond those analyst years, Simply Wall St extrapolates further growth so that projected free cash flow climbs to roughly $3.68 billion by 2035, then applies a discount rate to convert each of those future figures into today’s dollars.
Bringing all of those discounted cash flows together produces an intrinsic value of HK$27.15 per share. Compared with the current market price, the DCF implies the stock is trading at about a 63.5% discount. This indicates there could be meaningful upside for investors if the cash flow trajectory plays out as assumed.
Result: UNDERVALUED
Our Discounted Cash Flow (DCF) analysis suggests Lenovo Group is undervalued by 63.5%. Track this in your watchlist or portfolio, or discover 908 more undervalued stocks based on cash flows.
Approach 2: Lenovo Group Price vs Earnings
For profitable businesses like Lenovo Group, the price to earnings, or PE, ratio is a useful way to gauge whether investors are paying a reasonable price for each dollar of current earnings. In general, companies with faster, more reliable growth and lower perceived risk usually justify a higher normal or fair PE, while slower growth or higher uncertainty tends to cap how much investors are willing to pay.
Lenovo currently trades on a PE of about 9.7x. That is well below the broader Tech industry average of roughly 22.6x, and also sits at a steep discount to the 29.9x average of its closest peers. However, simply comparing to industry or peers can be misleading, because it ignores Lenovo’s own earnings growth outlook, profitability profile, risk factors and size.
Simply Wall St’s Fair Ratio metric tries to solve that by estimating what PE multiple Lenovo should trade on, given its growth, margins, risk profile, industry and market cap. For Lenovo, this Fair Ratio comes out at about 15.3x, noticeably higher than the current 9.7x. This suggests the market is pricing Lenovo below what its fundamentals might warrant, even after adjusting for risks.
Result: UNDERVALUED

PE ratios tell one story, but what if the real opportunity lies elsewhere? Discover 1442 companies where insiders are betting big on explosive growth.
Upgrade Your Decision Making: Choose your Lenovo Group Narrative
Earlier we mentioned that there is an even better way to understand valuation, so let us introduce you to Narratives, a simple framework on Simply Wall St’s Community page that lets you attach a clear story, your view on Lenovo Group’s future revenue, earnings and margins, to a financial forecast and then to a fair value that you can easily compare with today’s share price to decide whether you want to buy, hold, or sell.
Do you think there's more to the story for Lenovo Group? Head over to our Community to see what others are saying!
This article by Simply Wall St is general in nature. We provide commentary based on historical data and analyst forecasts only using an unbiased methodology and our articles are not intended to be financial advice. It does not constitute a recommendation to buy or sell any stock, and does not take account of your objectives, or your financial situation. We aim to bring you long-term focused analysis driven by fundamental data. Note that our analysis may not factor in the latest price-sensitive company announcements or qualitative material. Simply Wall St has no position in any stocks mentioned.
Have feedback on this article? Concerned about the content? Get in touch with us directly. Alternatively, email editorial-team@simplywallst.com