
- LIVE QUOTES
- LEARN
- HELP
 Nasdaq
 Wall Street Journal
EN
Has Visa’s Long Run Left Much Upside After 2025 Digital Payment Growth Expectations?
- Wondering if Visa is still attractive after such a long run up, or whether the easy money has already been made? Let us unpack what the current share price really implies about its future.
- Visa has slipped slightly in the short term, down 1.3% over 7 days and 2.2% over 30 days. It is still up 4.8% year to date and 7.1% over the last year, with a 62.2% gain over three years and 63.1% over five.
- Recently, markets have been digesting headlines around ongoing growth in digital payments, regulatory scrutiny of card fees in multiple regions, and the impact of interest rate expectations on financial stocks. At the same time, investors are watching how Visa positions itself against rising competition from fintechs and real time payment networks. This keeps sentiment active even without major company specific shocks.
- Right now, our checks suggest Visa only scores 1 out of 6 on undervaluation. That raises the question of whether the stock is fairly priced for quality or quietly expensive, and we will walk through different valuation approaches to consider that, before exploring another way to think about its value at the end of this article.
Visa scores just 1/6 on our valuation checks. See what other red flags we found in the full valuation breakdown.
Approach 1: Visa Excess Returns Analysis
The Excess Returns model looks at how much profit Visa can generate above the return that investors reasonably demand on its equity, and then capitalizes those surplus profits into a fair value per share.
For Visa, the starting point is a Book Value of $19.38 per share and a Stable EPS of $16.34 per share, based on weighted future Return on Equity estimates from 13 analysts. With an Average Return on Equity of 72.09%, Visa is projected to keep earning far more on each dollar of equity than its Cost of Equity of $1.68 per share.
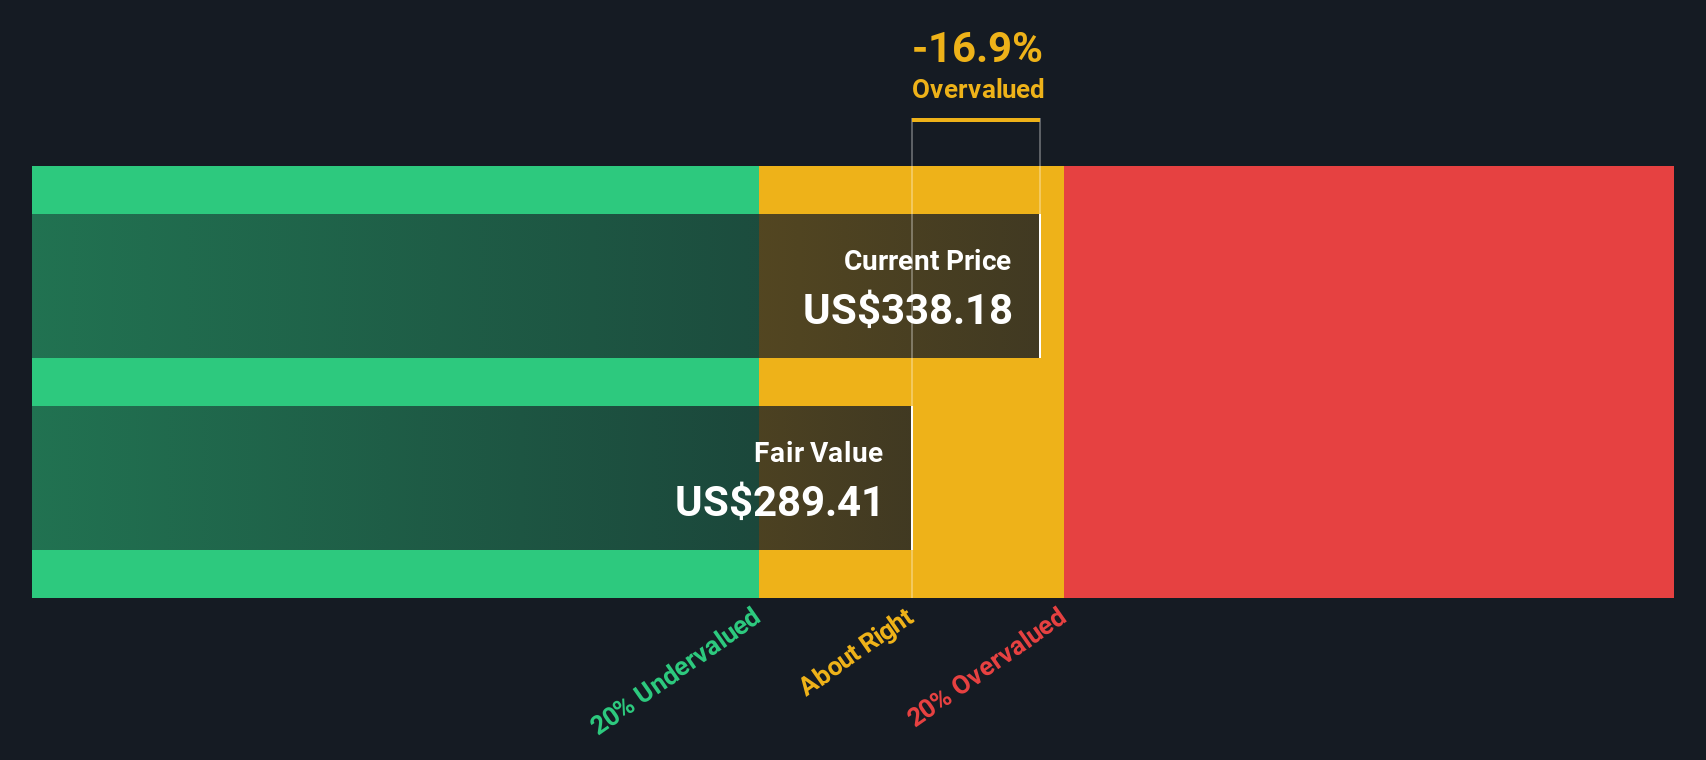
This gap translates into an Excess Return of $14.67 per share, supported by a Stable Book Value outlook of $22.67 per share from 9 analyst estimates. When these excess profits are projected forward and discounted, the model yields an intrinsic value of about $377 per share in dollar terms, implying the stock is roughly 12.6% undervalued versus the current price.
In short, the model indicates that Visa’s ability to earn exceptional returns on its capital is not fully reflected in today’s share price.
Result: UNDERVALUED
Our Excess Returns analysis suggests Visa is undervalued by 12.6%. Track this in your watchlist or portfolio, or discover 912 more undervalued stocks based on cash flows.
Approach 2: Visa Price vs Earnings
For a profitable, mature business like Visa, the price to earnings ratio is a useful yardstick because it links what investors pay today directly to the company’s current earnings power. A higher growth outlook or lower perceived risk usually justifies a higher normal PE multiple, while slower growth or greater uncertainty should pull that multiple down.
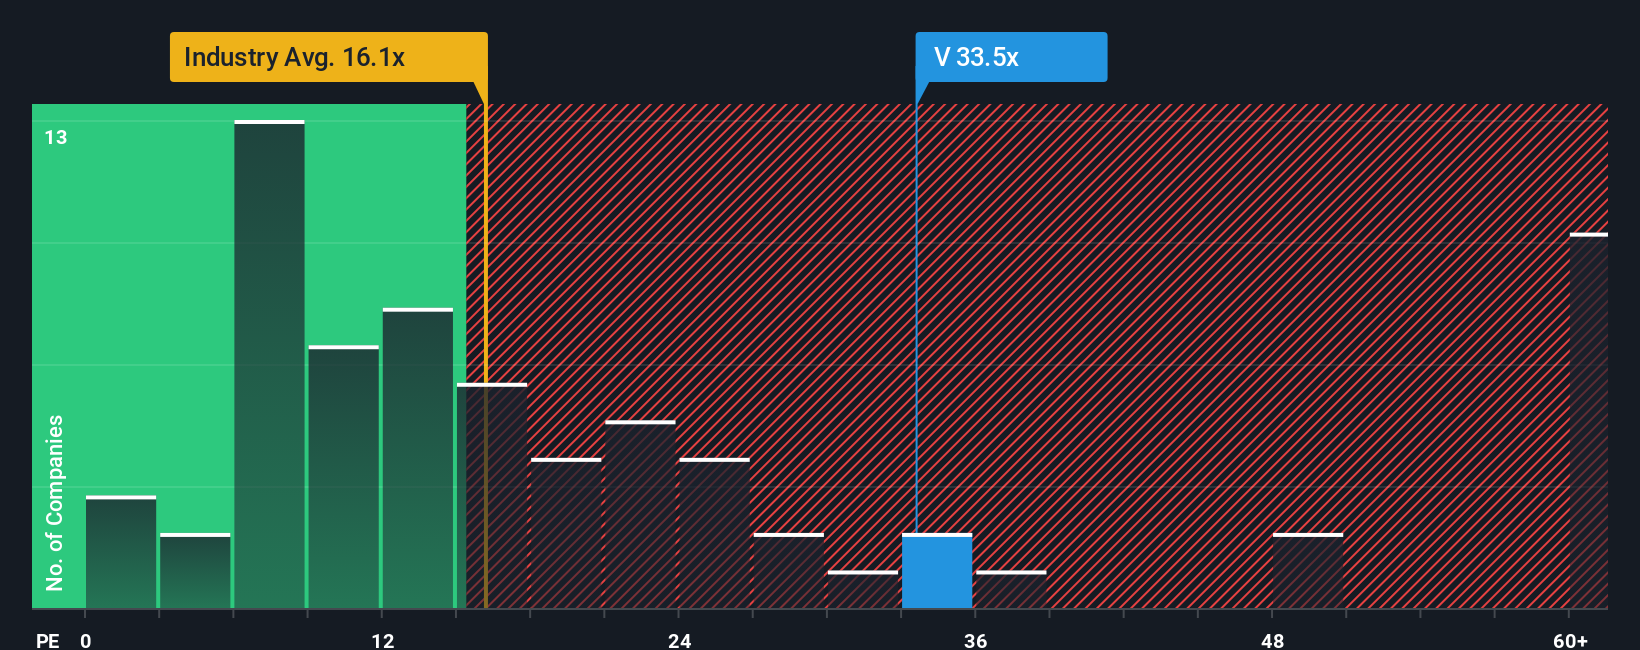
Visa currently trades at about 31.78x earnings, which is well above the Diversified Financial industry average of roughly 13.74x and also ahead of the peer group average of about 17.10x. At first glance, that premium might look stretched, but it reflects Visa’s strong margins, dominant competitive position and consistent growth record.
Simply Wall St’s Fair Ratio framework refines this comparison by estimating what PE you would reasonably expect for Visa once you factor in its earnings growth, profitability, size, risks and industry context. For Visa, that Fair Ratio is 19.93x, which sits meaningfully below the current 31.78x. Because this approach adjusts for growth, risk and quality, it offers a more tailored benchmark than relying on blunt peer or industry comparisons alone. On this basis, Visa’s share price looks higher than what its fundamentals justify today.
Result: OVERVALUED
PE ratios tell one story, but what if the real opportunity lies elsewhere? Discover 1443 companies where insiders are betting big on explosive growth.
Upgrade Your Decision Making: Choose your Visa Narrative
Earlier we mentioned that there is an even better way to understand valuation, so let us introduce you to Narratives, a simple framework that connects your view of Visa’s story to a concrete forecast and a fair value estimate.
A Narrative on Simply Wall St lets you spell out how you think Visa’s business will evolve, then link that story to specific assumptions for future revenue, earnings and margins, so the numbers clearly reflect your thesis rather than a generic model.
Because each Narrative ties Visa’s story to a cash flow forecast and resulting fair value, it becomes a practical decision tool, helping you compare that fair value with the current share price so you can see whether your story suggests it is time to buy, hold or sell.
Narratives, available within the Community section used by millions of investors, update dynamically as new earnings or news arrives, so your conclusions stay aligned with the latest information, and you can easily see how other investors’ Visa Narratives differ, from those expecting upside toward around $430 per share to more cautious views closer to $305 per share.
Do you think there's more to the story for Visa? Head over to our Community to see what others are saying!

This article by Simply Wall St is general in nature. We provide commentary based on historical data and analyst forecasts only using an unbiased methodology and our articles are not intended to be financial advice. It does not constitute a recommendation to buy or sell any stock, and does not take account of your objectives, or your financial situation. We aim to bring you long-term focused analysis driven by fundamental data. Note that our analysis may not factor in the latest price-sensitive company announcements or qualitative material. Simply Wall St has no position in any stocks mentioned.
Have feedback on this article? Concerned about the content? Get in touch with us directly. Alternatively, email editorial-team@simplywallst.com