
- LIVE QUOTES
- LEARN
- HELP
 Nasdaq
 Wall Street Journal
EN
Is It Too Late to Consider Cloudflare After Its Huge AI Driven Run in 2025?
- If you are wondering whether Cloudflare is still worth buying after its huge run, or if the best days are already priced in, you are not alone. This article is going to tackle that question head on.
- The stock has climbed 84.6% over the last year and an eye-catching 361.6% over three years. This comes even after a recent 17.6% pullback in the last 30 days that follows an 81.6% gain year to date.
- Recent headlines have focused on Cloudflare expanding its edge computing and security platforms with new AI-focused capabilities and deepening partnerships with major cloud providers. This reinforces the narrative that it sits at the crossroads of internet performance and next-generation infrastructure. At the same time, analysts and commentators have been debating whether this growth story justifies such a rich share price, putting valuation front and center for investors.
- On our checklist of 6 valuation tests, Cloudflare scores just 0/6 for being undervalued. Next, we will walk through the usual valuation approaches and then finish with a more holistic way of thinking about what the stock might really be worth.
Cloudflare scores just 0/6 on our valuation checks. See what other red flags we found in the full valuation breakdown.
Approach 1: Cloudflare Discounted Cash Flow (DCF) Analysis
A Discounted Cash Flow model estimates what a business is worth today by projecting its future cash flows and then discounting those projections back to the present.
For Cloudflare, the latest twelve month Free Cash Flow is about $269.4 million. Analysts and internal estimates see this rising steadily, with projections climbing to just over $1.2 billion of Free Cash Flow by 2029 and continuing to grow toward roughly $2.8 billion by 2035. These longer term numbers combine analyst forecasts for the next few years with Simply Wall St extrapolations beyond that horizon.
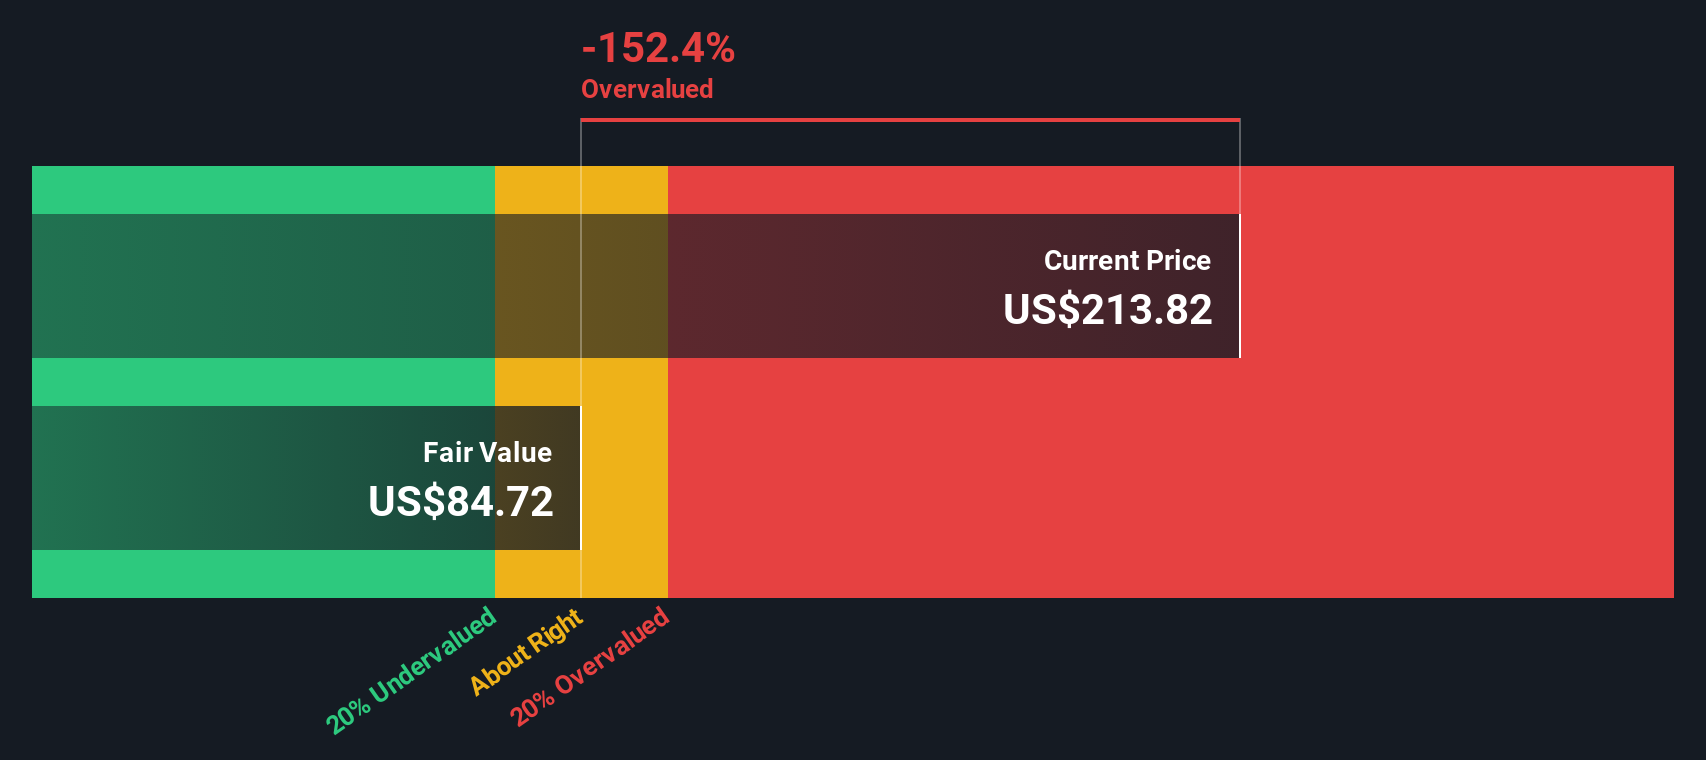
By discounting this stream of cash flows using a 2 Stage Free Cash Flow to Equity model, the estimated intrinsic value comes out at roughly $85.48 per share. Compared to the current market price, this implies the stock is about 139.1% overvalued based on this DCF framework, so the market is assuming far more optimistic outcomes than the model.
Result: OVERVALUED
Our Discounted Cash Flow (DCF) analysis suggests Cloudflare may be overvalued by 139.1%. Discover 919 undervalued stocks or create your own screener to find better value opportunities.
Approach 2: Cloudflare Price vs Sales
For companies like Cloudflare that are still prioritizing growth over bottom line profits, the Price to Sales ratio is often a better yardstick than earnings based metrics. It lets us compare how richly the market is valuing each dollar of revenue, which tends to be more stable and meaningful at this stage.
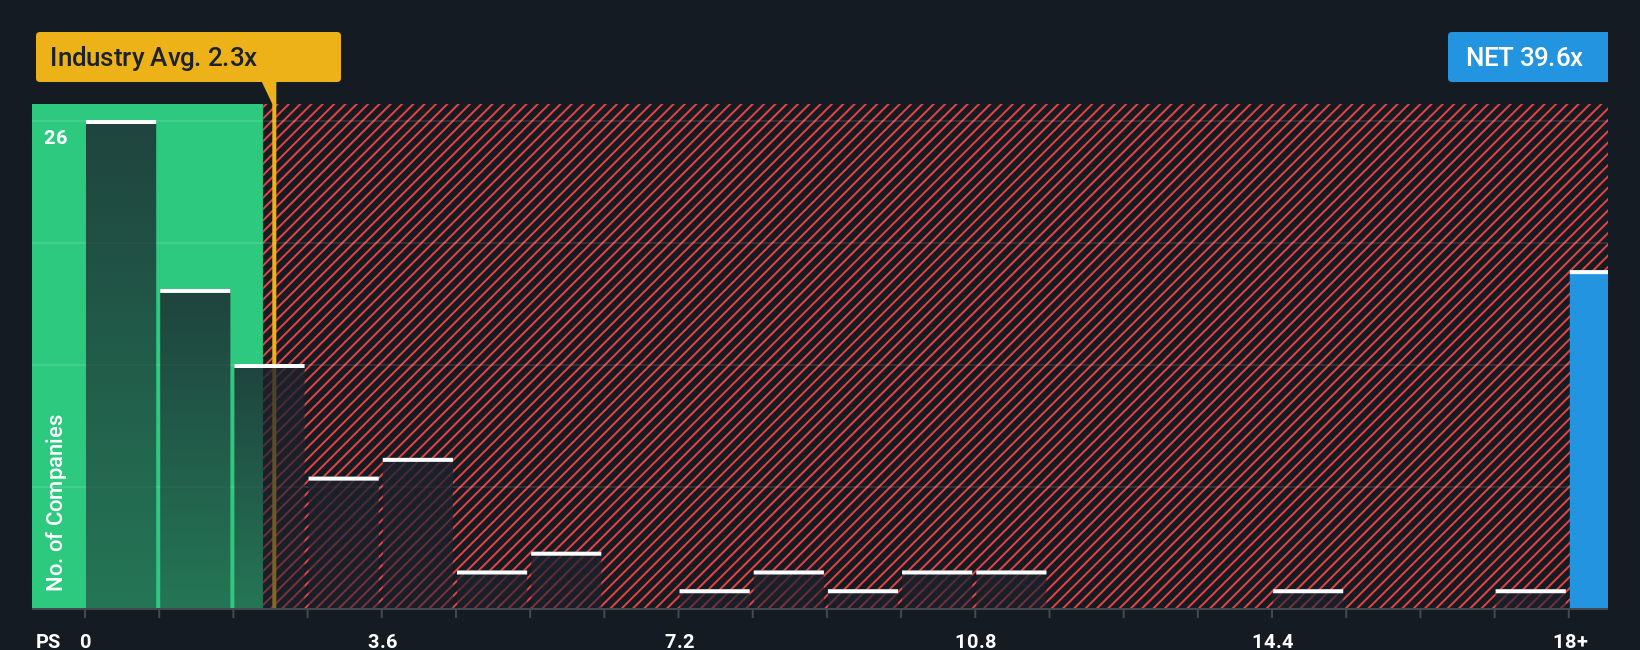
In general, faster growing and less risky businesses can justify a higher sales multiple, while slower or riskier names should trade on a lower one. Cloudflare currently trades on a lofty 35.55x Price to Sales ratio, far above the broader IT industry average of around 2.51x and even well ahead of its high growth peer group at roughly 17.45x.
Simply Wall St takes this a step further with its Fair Ratio, a proprietary estimate of what a reasonable Price to Sales multiple should be after factoring in Cloudflare’s growth outlook, risk profile, margins, industry and market cap. On this basis, Cloudflare’s Fair Ratio is calculated at about 15.19x. With the current multiple more than double that level, the shares still appear expensive even after the recent pullback.
Result: OVERVALUED
PS ratios tell one story, but what if the real opportunity lies elsewhere? Discover 1441 companies where insiders are betting big on explosive growth.
Upgrade Your Decision Making: Choose your Cloudflare Narrative
Earlier we mentioned that there is an even better way to understand valuation, so let us introduce you to Narratives, a simple framework that lets you attach a clear story to your numbers by spelling out your view of a company’s future revenue, earnings, and margins, linking that story to a forecast and then to a Fair Value estimate you can easily compare with the current share price to decide whether to buy, hold, or sell.
On Simply Wall St, Narratives live in the Community page and are used by millions of investors as an accessible, dynamic tool that automatically updates when new information, like earnings or major news, comes in. This means your story and Fair Value are always in sync with reality rather than frozen in a one off model.
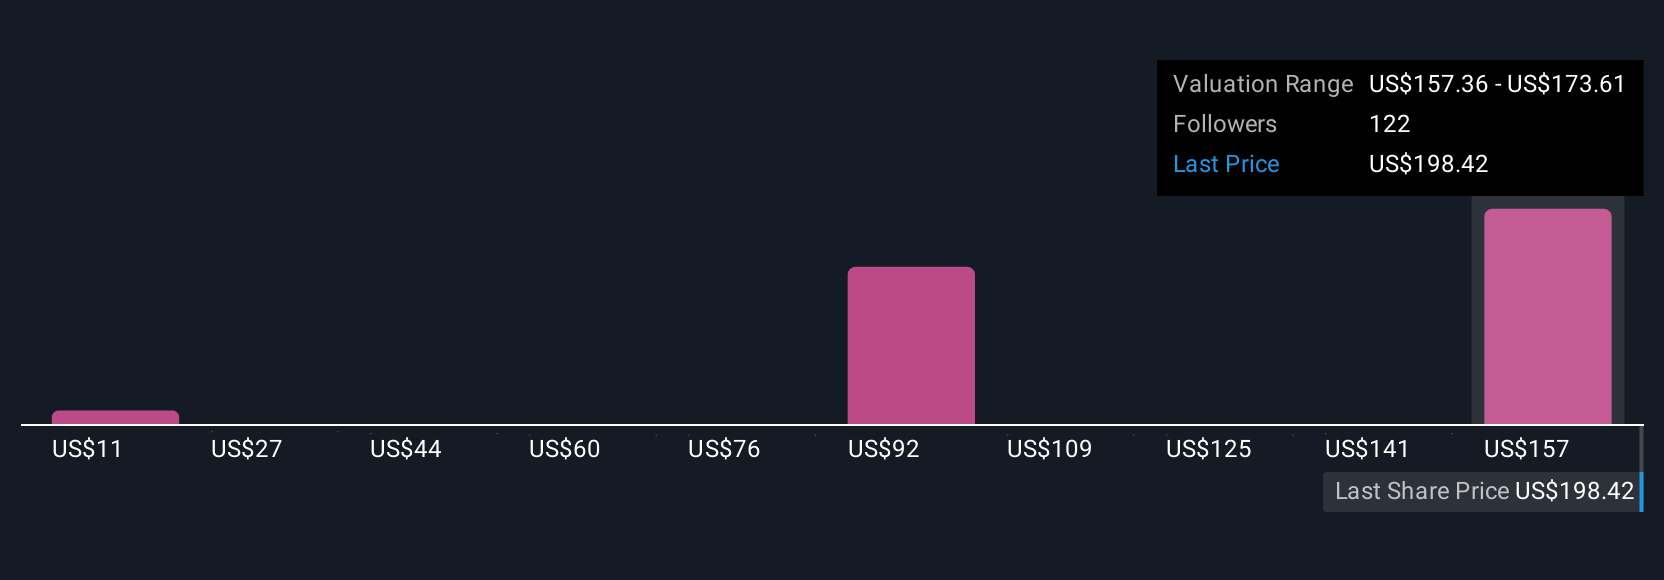
For Cloudflare, for example, one investor might build a bullish Narrative that assumes the Street high fair value of about $255 per share because they believe AI momentum, zero trust adoption, and new agentic web initiatives will drive sustained growth and rising margins. Another more cautious investor could anchor on the low target near $90 with slower growth and margin pressure in mind, and Narratives helps both translate those perspectives into concrete forecasts and price targets they can monitor as conditions change.
Do you think there's more to the story for Cloudflare? Head over to our Community to see what others are saying!
This article by Simply Wall St is general in nature. We provide commentary based on historical data and analyst forecasts only using an unbiased methodology and our articles are not intended to be financial advice. It does not constitute a recommendation to buy or sell any stock, and does not take account of your objectives, or your financial situation. We aim to bring you long-term focused analysis driven by fundamental data. Note that our analysis may not factor in the latest price-sensitive company announcements or qualitative material. Simply Wall St has no position in any stocks mentioned.
Have feedback on this article? Concerned about the content? Get in touch with us directly. Alternatively, email editorial-team@simplywallst.com