
- LIVE QUOTES
- LEARN
- HELP
 Nasdaq
 Wall Street Journal
EN
Is It Too Late To Consider Sempra After Its 65% Five Year Run?
- If you are wondering whether Sempra at around $90 a share is still a solid opportunity or if the easy money has already been made, you are not alone in asking whether the current price really reflects its long term value.
- Despite a soft patch in the short term, with the stock down 3.3% over the past week and 2.0% over the last month, Sempra is still up 4.1% year to date and has delivered 65.2% over 5 years, which quietly signals durable compounding for patient holders.
- Recent moves in the share price have come against a backdrop of steady progress in Sempra's regulated utility and infrastructure projects, alongside ongoing investment in grid resilience and energy transition initiatives that keep it central to long term demand trends. At the same time, sector wide shifts in interest rate expectations and renewed investor focus on defensive, cash generating names have helped reframe how the market prices utilities like Sempra.
- Right now, Sempra scores just 1/6 on our valuation checks, hinting that the market may not be offering a broad based bargain, but that some pockets of value could still exist. Next, we will break down what different valuation approaches say about Sempra, and then circle back to a more holistic way of thinking about its true worth that goes beyond any single model.
Sempra scores just 1/6 on our valuation checks. See what other red flags we found in the full valuation breakdown.
Approach 1: Sempra Dividend Discount Model (DDM) Analysis
The Dividend Discount Model estimates what a stock is worth by projecting all future dividends, growing them at a sustainable rate, and discounting them back to today. It is especially useful for mature, dividend paying companies like Sempra.
In Sempra's case, the model starts with an annual dividend per share of about $2.98 and assumes returns on equity of roughly 9.7%. With a payout ratio near 54.5%, just under half of earnings are being reinvested to drive future growth. From this, the model infers a long run dividend growth rate of about 3.3%, capped down from a higher raw estimate, and an expected overall growth profile of roughly 4.4% a year to keep expectations realistic.
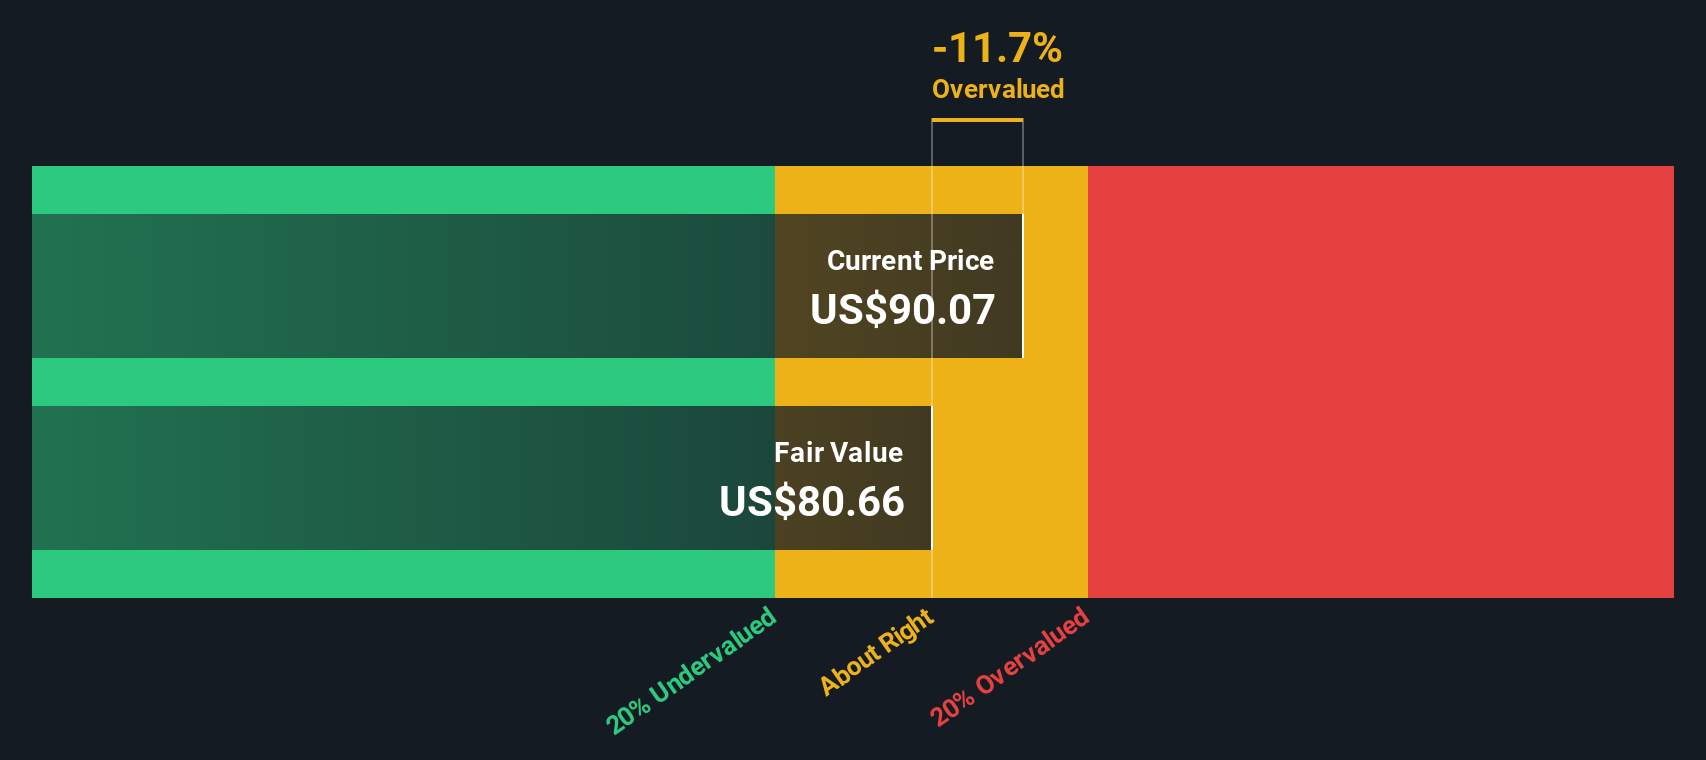
Feeding these inputs into the DDM produces an estimated intrinsic value of about $80.66 per share, implying the stock is roughly 12.5% above where the model estimates it should trade. On this framework, Sempra appears slightly expensive rather than a clear bargain.
Result: OVERVALUED
Our Dividend Discount Model (DDM) analysis suggests Sempra may be overvalued by 12.5%. Discover 917 undervalued stocks or create your own screener to find better value opportunities.
Approach 2: Sempra Price vs Earnings
For profitable, established companies like Sempra, the price to earnings ratio is a useful shorthand for how much investors are willing to pay for each dollar of current earnings. It naturally captures both performance today and what the market expects those earnings to do over time.
In practice, what counts as a fair PE depends on how quickly earnings are expected to grow and how risky those earnings are. Faster, more dependable growth can justify paying a higher multiple, while slower or less certain growth usually deserves a discount. Sempra currently trades on about 28.1x earnings, well above the Integrated Utilities industry average of roughly 18.0x and also ahead of the peer group average near 19.2x. This suggests the market is already baking in a premium outlook.
Simply Wall St’s Fair Ratio framework goes a step further than simple comparisons by estimating what multiple would be reasonable for Sempra once its specific growth profile, risks, profit margins, industry backdrop and size are all accounted for. On this basis, Sempra’s Fair Ratio comes out at about 29.4x, only modestly higher than today’s 28.1x. This implies the valuation is not stretched relative to its fundamentals.
Result: ABOUT RIGHT

PE ratios tell one story, but what if the real opportunity lies elsewhere? Discover 1442 companies where insiders are betting big on explosive growth.
Upgrade Your Decision Making: Choose your Sempra Narrative
Earlier we mentioned that there is an even better way to understand valuation, so let us introduce you to Narratives, which are simply the stories investors tell about a company, backed up by their own assumptions for fair value, future revenue, earnings and margins.
A Narrative links three things together in one place: what you think Sempra’s business story is, how that story translates into a financial forecast, and what that forecast implies for fair value today.
On Simply Wall St, Narratives are an easy, accessible tool on the Community page used by millions of investors. They help you quickly see whether your view suggests Sempra is worth more or less than its current price so you can decide if it is a buy, hold or sell.
Because Narratives update automatically when fresh news, earnings or guidance arrive, your fair value view stays dynamic, not static.
For example, one investor might build a bullish Sempra Narrative around analysts’ higher fair value of $99.07 driven by margin expansion and steady LNG progress. Another could lean on a more cautious view closer to the earlier $83.92 consensus target that incorporates regulatory and LNG demand risks. Comparing each Narrative’s fair value to today’s price makes their different decisions obvious in seconds.
Do you think there's more to the story for Sempra? Head over to our Community to see what others are saying!

This article by Simply Wall St is general in nature. We provide commentary based on historical data and analyst forecasts only using an unbiased methodology and our articles are not intended to be financial advice. It does not constitute a recommendation to buy or sell any stock, and does not take account of your objectives, or your financial situation. We aim to bring you long-term focused analysis driven by fundamental data. Note that our analysis may not factor in the latest price-sensitive company announcements or qualitative material. Simply Wall St has no position in any stocks mentioned.
Have feedback on this article? Concerned about the content? Get in touch with us directly. Alternatively, email editorial-team@simplywallst.com