
- LIVE QUOTES
- LEARN
- HELP
 Nasdaq
 Wall Street Journal
EN
NIP Group (NIPG) Net Losses Dominate H1 2025, Reinforcing Bearish Profitability Narratives
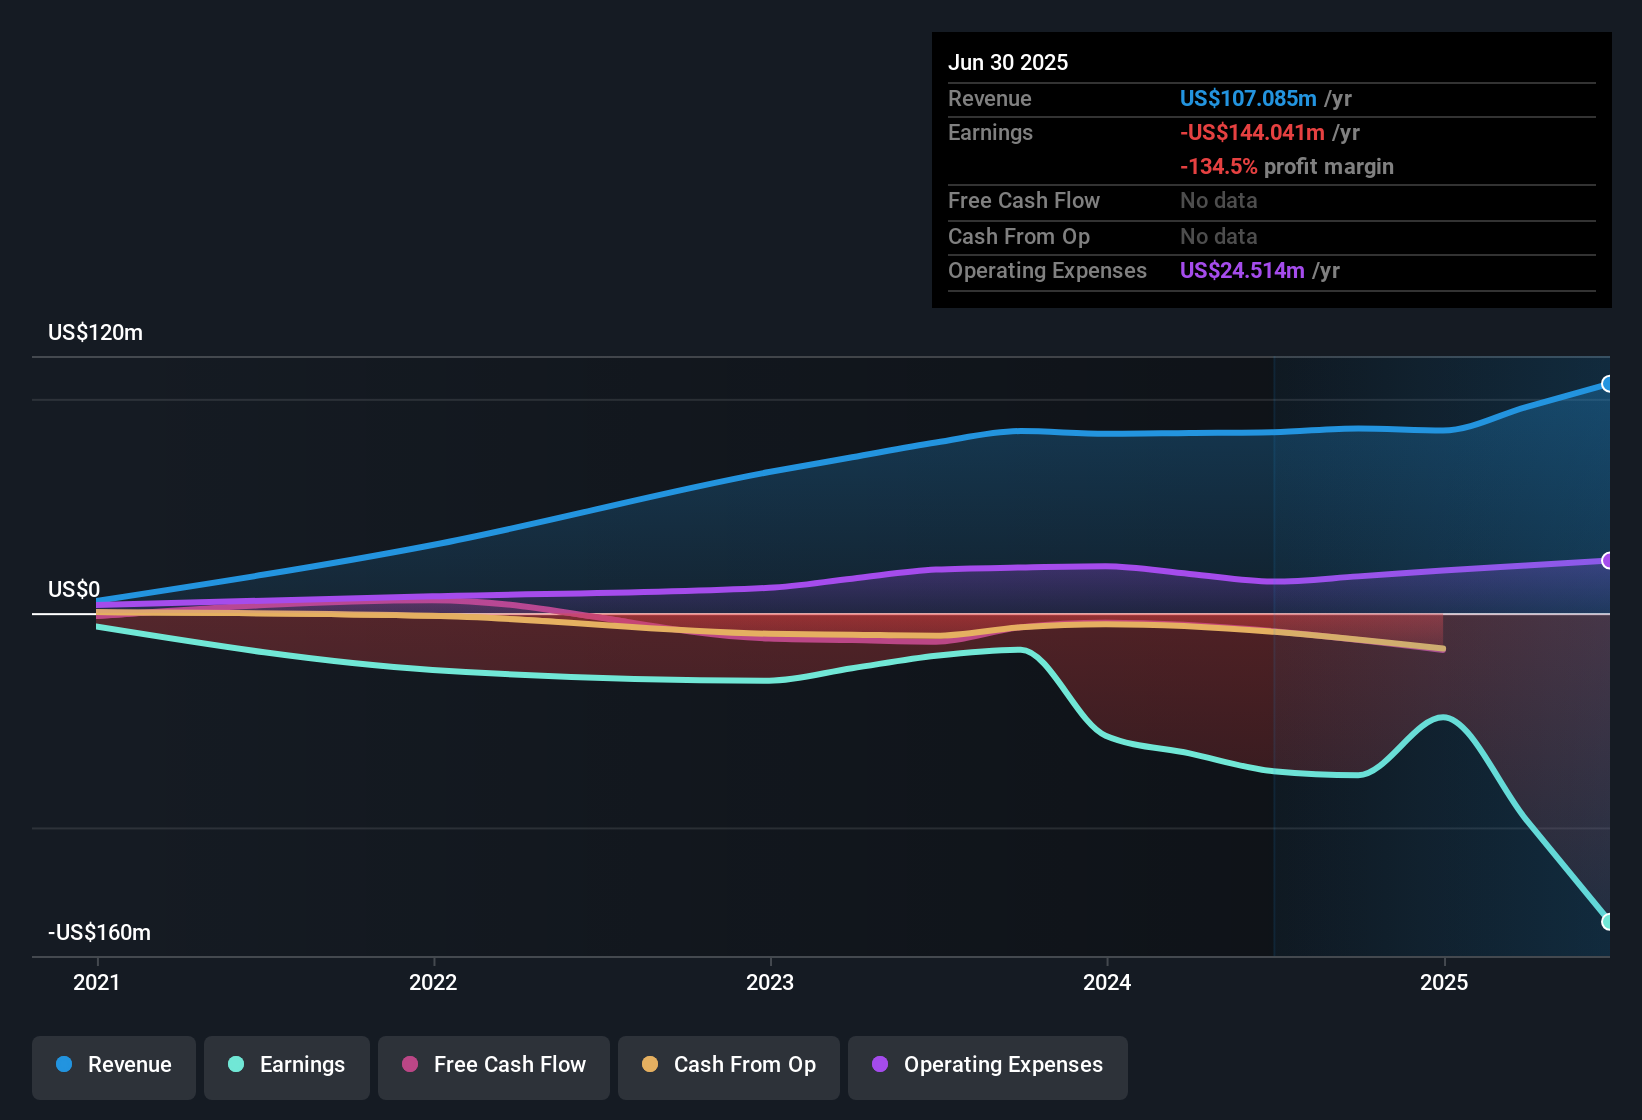
NIP Group (NIPG) has kicked off H1 2025 with total revenue of about $45.9 million and basic EPS of roughly -$0.16, setting a cautious tone as the market digests another loss-making half. The company has seen revenue hover in the mid-$40 million range over recent periods, from about $45.1 million in H2 2023 to $39.3 million in H1 2024 and back to $45.9 million in H2 2024. Basic EPS stayed negative across the board, ranging from roughly -$1.64 to -$2.09 before the latest -$0.16 print. With the top line holding around the same band but EPS still in the red, investors are likely to focus on how effectively NIP Group can tighten its margins and turn forecast revenue growth into a credible path toward profitability.
See our full analysis for NIP Group.With the latest half in the books, the next step is to see how these results measure up against the key bullish and bearish narratives around NIP Group, highlighting where the numbers back the story and where they call it into question.
Curious how numbers become stories that shape markets? Explore Community Narratives
LTM Net Loss Tops $215.9 Million
- Over the last twelve months, NIP Group generated about $107.1 million in revenue but posted roughly $215.9 million in net losses, showing that the business is still far from break even despite the top line holding above $100 million.
- Bears point to this combination of scale and losses to argue the model is not working yet, and the data backs that up:
- Five year losses have been growing at about 52.6% per year, and trailing basic EPS sits at about -$5.46, so the deeper history lines up with the current unprofitable picture.
- Forecasts also call for NIP Group to remain unprofitable for at least the next three years, which means there is no numbers based sign yet that these large losses are set to reverse soon.
17% Revenue Growth Forecast Versus Market
- Revenue is projected to grow around 17.1% per year, noticeably faster than the roughly 10.5% annual growth expected for the broader US market, so the company is being treated as a higher growth play even while it is loss making.
- Optimistic investors lean on that growth angle, and the numbers partly support their case while also revealing the trade off:
- Historical semiannual revenue has stayed in the $39 million to $46 million band, yet forecasts imply that, over time, the esports and digital entertainment platform could scale meaningfully if it executes on that mid teens growth path.
- At the same time, those bulls have to reconcile this growth story with the negative net margins and trailing twelve month net loss of about $215.9 million, since none of the current data shows revenue growth translating into profits yet.
Price To Sales 1.5x With Dilution
- At a price to sales ratio of about 1.5 times compared with roughly 1.4 times for the broader US Entertainment industry and about 0.6 times for peers, the stock trades at a premium valuation despite recent shareholder dilution and ongoing losses.
- Critics highlight this valuation as a key concern, and the fundamentals give that view some weight:
- Shareholders have already seen substantial dilution over the past year, so the current $1.32 share price and 1.5 times sales multiple are sitting on top of a larger share base than before.
- Because forecasts still show no path to profitability over the next three years, that premium multiple is being supported mainly by the roughly 17.1% revenue growth outlook rather than any evidence of improving earnings or margins.
Next Steps
Don't just look at this quarter; the real story is in the long-term trend. We've done an in-depth analysis on NIP Group's growth and its valuation to see if today's price is a bargain. Add the company to your watchlist or portfolio now so you don't miss the next big move.
Explore Alternatives
Heavy ongoing losses, limited visibility on a path to profitability, and shareholder dilution all suggest that NIP Group carries significant valuation and execution risk.
If you want opportunities where the price tag better reflects fundamentals and future potential, use our these 932 undervalued stocks based on cash flows today to uncover candidates that look more attractively priced than this high risk profile implies.
This article by Simply Wall St is general in nature. We provide commentary based on historical data and analyst forecasts only using an unbiased methodology and our articles are not intended to be financial advice. It does not constitute a recommendation to buy or sell any stock, and does not take account of your objectives, or your financial situation. We aim to bring you long-term focused analysis driven by fundamental data. Note that our analysis may not factor in the latest price-sensitive company announcements or qualitative material. Simply Wall St has no position in any stocks mentioned.
Have feedback on this article? Concerned about the content? Get in touch with us directly. Alternatively, email editorial-team@simplywallst.com