
- LIVE QUOTES
- LEARN
- HELP
 Nasdaq
 Wall Street Journal
EN
Is TJX Still Attractive After Strong Multi Year Gains And Resilient Off Price Momentum
- Wondering if TJX Companies is still a bargain after its long run, or if most of the easy money has already been made? This breakdown will help you decide whether the current price really matches the value.
- The stock has slipped about 1.6% over the last week, but that comes after a solid 7.1% gain in the past month and strong longer term returns of 23.8% year to date and 21.7% over the last year, with almost 97.1% over three years and 147.0% over five years.
- Recent headlines have highlighted TJX's continued resilience in off price retail and its ability to draw value focused shoppers even as consumer spending patterns shift. This reinforces the idea that the business model is built for choppy economic conditions. Investors are watching how TJX balances traffic growth, merchandising, and inventory discipline as broader retail trends evolve.
- Despite that strength, TJX currently scores just 0/6 on our valuation checks, which might surprise anyone looking only at the share price chart. In the next sections we will unpack what different valuation approaches say about the stock and hint at an even more robust way to think about its fair value by the end of the article.
TJX Companies scores just 0/6 on our valuation checks. See what other red flags we found in the full valuation breakdown.
Approach 1: TJX Companies Discounted Cash Flow (DCF) Analysis
A Discounted Cash Flow model estimates what a business is worth by projecting the cash it can generate in the future and then discounting those cash flows back to today. For TJX Companies, the model uses a 2 Stage Free Cash Flow to Equity approach based on cash flow projections and a longer term fade in growth.
TJX generated trailing twelve month free cash flow of about $4.49 billion, and analysts expect this to rise gradually over time, with Simply Wall St extrapolating beyond the initial analyst horizon. By 2030, free cash flow is projected to reach roughly $6.55 billion, with intermediate yearly forecasts between 2026 and 2035 also feeding into the calculation. These future cash flows are discounted back to a present value in $ to estimate what the equity is worth today.
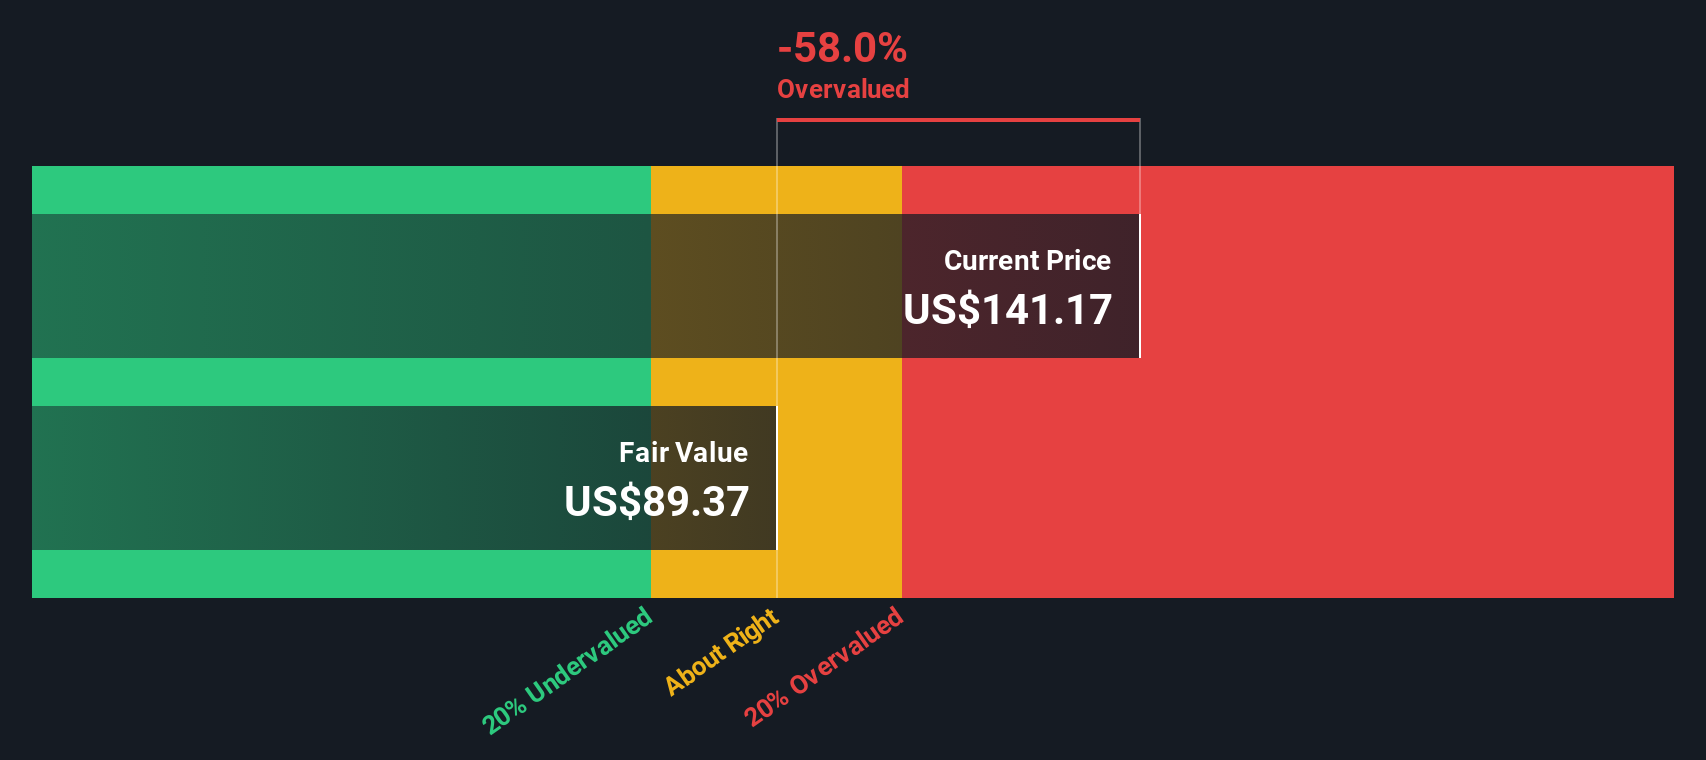
On this basis, the DCF model arrives at an intrinsic value of about $101.05 per share. Compared with the current share price, this implies the stock is roughly 48.5% overvalued, indicating that much of the anticipated cash flow growth already appears to be reflected in the price.
Result: OVERVALUED
Our Discounted Cash Flow (DCF) analysis suggests TJX Companies may be overvalued by 48.5%. Discover 935 undervalued stocks or create your own screener to find better value opportunities.
Approach 2: TJX Companies Price vs Earnings
For profitable companies like TJX, the price to earnings (PE) ratio is a useful way to gauge whether investors are paying a reasonable price for each dollar of current earnings. In general, businesses with stronger, more reliable growth and lower perceived risk can justify a higher PE, while slower growing or riskier names tend to trade on lower multiples.
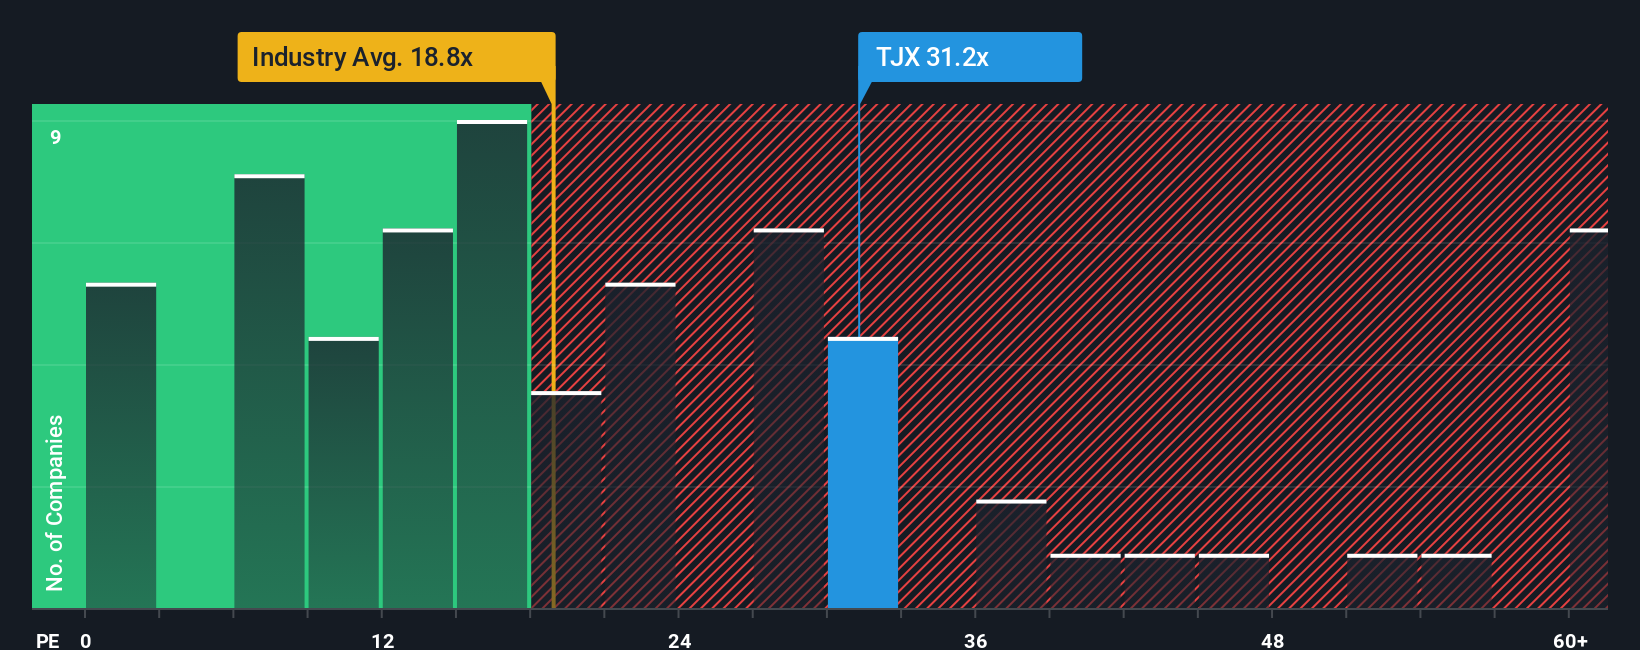
TJX currently trades on a PE of about 32.6x, which is well above both the Specialty Retail industry average of roughly 18.1x and the broader peer group average of around 20.2x. Simply Wall St goes a step further with its proprietary Fair Ratio, which estimates what PE the market might typically assign to TJX given its earnings growth profile, margins, size, industry and risk factors. For TJX, that Fair Ratio comes out at about 22.1x, notably below where the shares trade today. Because this Fair Ratio is tailored to the company, it offers a more nuanced benchmark than simple peer or industry comparisons.
Comparing the Fair Ratio of 22.1x with the actual PE of 32.6x suggests the stock is trading at a premium to what its fundamentals justify.
Result: OVERVALUED
PE ratios tell one story, but what if the real opportunity lies elsewhere? Discover 1441 companies where insiders are betting big on explosive growth.
Upgrade Your Decision Making: Choose your TJX Companies Narrative
Earlier we mentioned that there is an even better way to understand valuation, so let us introduce you to Narratives, a simple way to connect your view of the TJX Companies story with the numbers behind its future revenue, earnings, margins and fair value.
A Narrative is your own investment storyline, where you spell out what you think will drive TJX traffic, store growth and profitability, then link those beliefs to a concrete financial forecast and a fair value estimate instead of relying only on static multiples.
On Simply Wall St, Narratives live in the Community page and are designed to be easy to use. They aim to help investors compare their Narrative Fair Value to the current market price, and then automatically update as new earnings, guidance or news flows in.
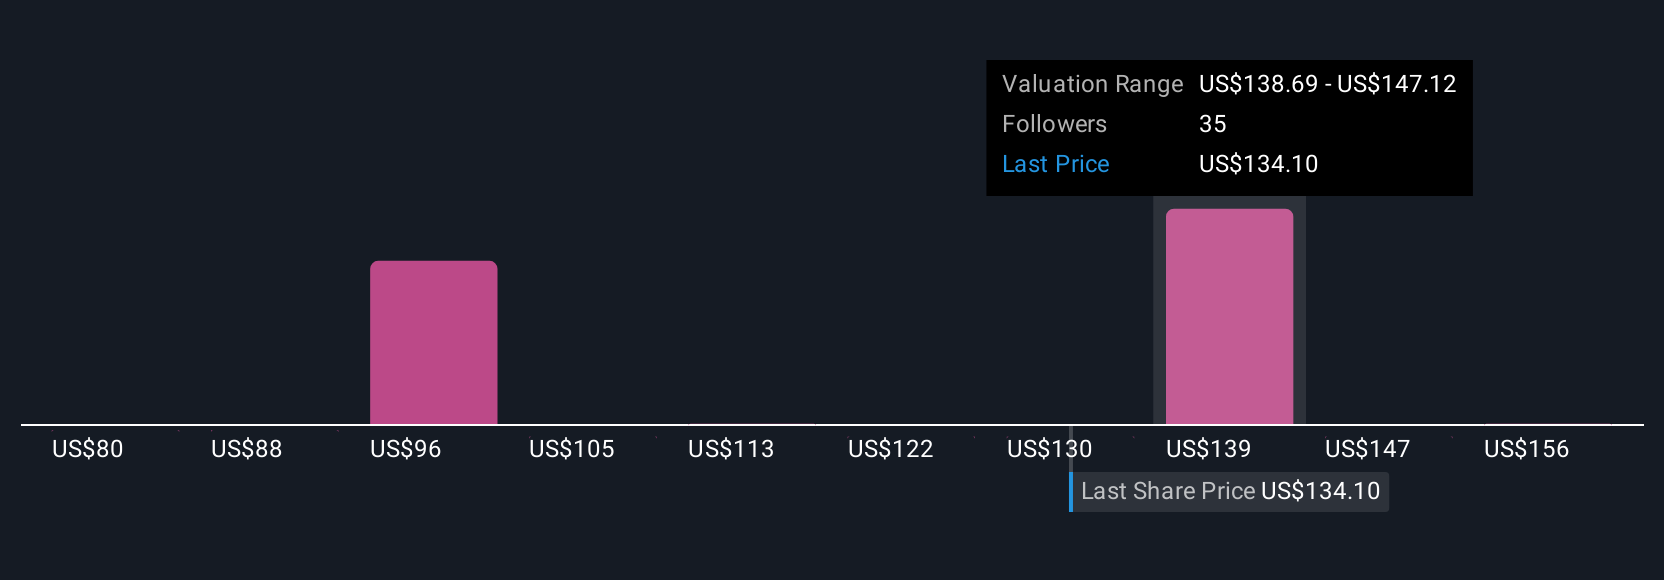
For example, one TJX Narrative might be cautious, assuming a fair value closer to about $90 per share if you think growth and margins will fade. Another more optimistic Narrative could justify a fair value near $164 per share if you believe global expansion, strong off-price demand and margin improvements will stay stronger for longer.
Do you think there's more to the story for TJX Companies? Head over to our Community to see what others are saying!
This article by Simply Wall St is general in nature. We provide commentary based on historical data and analyst forecasts only using an unbiased methodology and our articles are not intended to be financial advice. It does not constitute a recommendation to buy or sell any stock, and does not take account of your objectives, or your financial situation. We aim to bring you long-term focused analysis driven by fundamental data. Note that our analysis may not factor in the latest price-sensitive company announcements or qualitative material. Simply Wall St has no position in any stocks mentioned.
Have feedback on this article? Concerned about the content? Get in touch with us directly. Alternatively, email editorial-team@simplywallst.com