
- LIVE QUOTES
- LEARN
- HELP
 Nasdaq
 Wall Street Journal
EN
Carter’s (CRI): Assessing Valuation After This Week’s Share Price Rally
See our latest analysis for Carter's.
Despite a sharp rally this week, Carter's share price is still well below its earlier highs, with a year-to-date return of -42.02%. For context, the total shareholder return over the past year is -40.39%, which points to longer-term challenges even as short-term momentum has picked up.
If Carter's rebound has you wondering what else is catching investors' attention, consider expanding your view and discover fast growing stocks with high insider ownership
With shares still well off their highs, investors face a key question: Is Carter's current price reflective of undervaluation and short-term momentum, or has the market already factored in the company’s growth prospects?
Most Popular Narrative: 5.8% Overvalued
Carter’s fair value estimate, based on the most popular narrative, sits above the last close price. Analysts have nudged fair value higher, but the shares still appear priced above this benchmark.
Declining birth rates and limited international growth constrain Carter's future revenue and earnings potential, keeping long-term demand and expansion prospects subdued. Intensifying competition from e-commerce and fast-fashion, plus cost pressures from tariffs and sustainability efforts, threaten Carter's profit margins and increase earnings volatility.
Curious how a shrinking core market and climbing costs could still result in today’s high valuation? The narrative relies on some bold assumptions about future profitability and multiples. There is a surprising equation behind Carter’s fair value story. Do you want to see what tips the balance?
Result: Fair Value of $29.50 (OVERVALUED)
Have a read of the narrative in full and understand what's behind the forecasts.
However, Carter's accelerating international growth and strong performance in its core baby segment could boost long-term revenues beyond current expectations.
Find out about the key risks to this Carter's narrative.
Another View: A Closer Look at Valuation Multiples
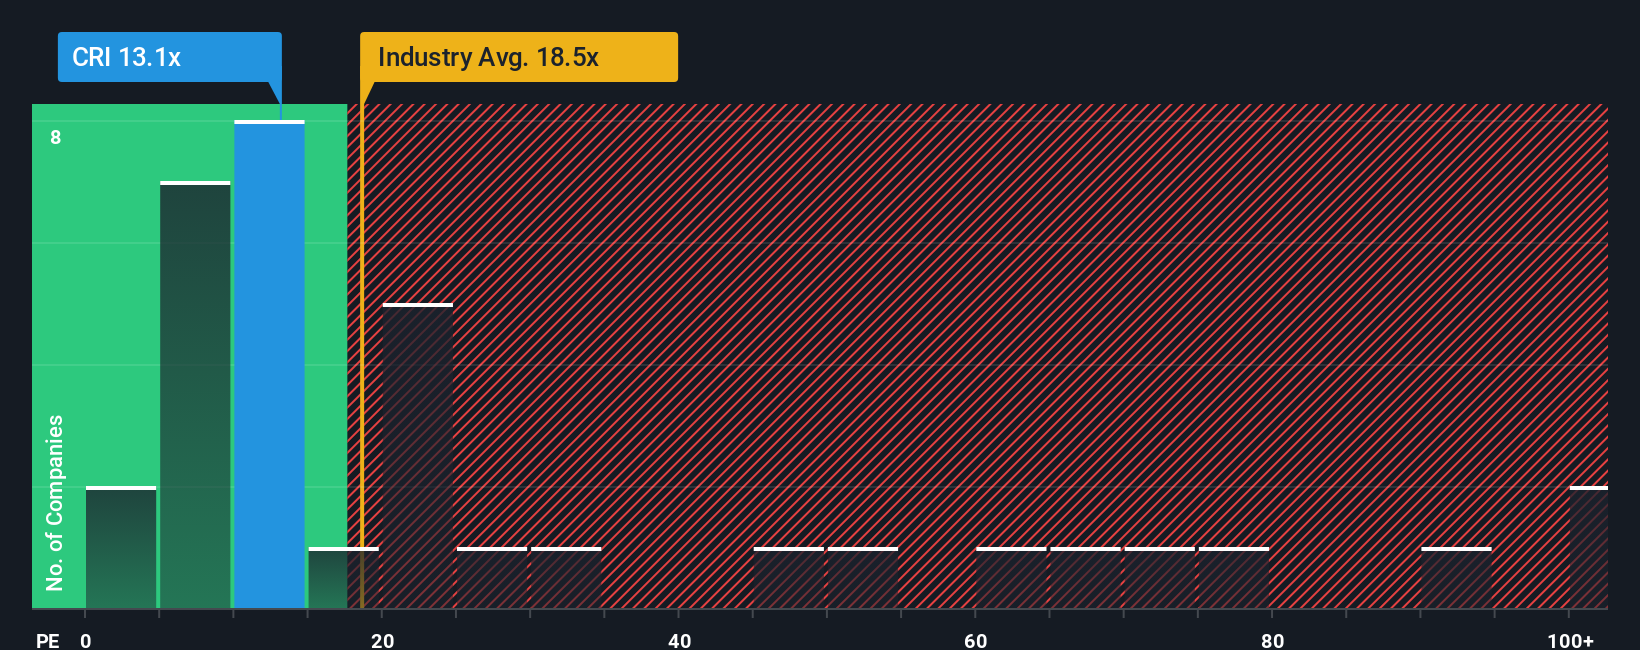
On the other hand, Carter’s is trading at a price-to-earnings ratio of 13.1x, which is notably lower than both the US Luxury industry average of 19.6x and its peer average of 34.8x. This ratio also sits just below the fair ratio of 13.3x, suggesting the shares are priced conservatively by this measure. Still, does this gap point to opportunity, or is it a warning about future growth?
See what the numbers say about this price — find out in our valuation breakdown.
Build Your Own Carter's Narrative
If you have a different perspective or would like to analyze the numbers on your own terms, you can craft your own view in just a few minutes. Do it your way.
A great starting point for your Carter's research is our analysis highlighting 3 key rewards and 3 important warning signs that could impact your investment decision.
Looking for more investment ideas?
Don’t miss your chance to get ahead of the next big trend. Use the Simply Wall Street Screener for fresh insights, untapped stocks, and industry-shaping moves.
- Uncover income opportunities by checking out these 14 dividend stocks with yields > 3% offering yields above 3% that could boost your returns.
- Spot tech innovators pushing the boundaries of finance, automation, and security among these 26 AI penny stocks.
- Access these 924 undervalued stocks based on cash flows to find companies trading below their fair value based on powerful cash flow analysis.
This article by Simply Wall St is general in nature. We provide commentary based on historical data and analyst forecasts only using an unbiased methodology and our articles are not intended to be financial advice. It does not constitute a recommendation to buy or sell any stock, and does not take account of your objectives, or your financial situation. We aim to bring you long-term focused analysis driven by fundamental data. Note that our analysis may not factor in the latest price-sensitive company announcements or qualitative material. Simply Wall St has no position in any stocks mentioned.
Have feedback on this article? Concerned about the content? Get in touch with us directly. Alternatively, email editorial-team@simplywallst.com