
- LIVE QUOTES
- LEARN
- HELP
 Nasdaq
 Wall Street Journal
EN
Is Amkor Technology Attractively Priced After 10% Drop Amid Automotive Chip Expansion News?
- Ever looked at Amkor Technology and wondered if its shares are actually a bargain or just riding the semiconductor buzz? You're not alone, and we're about to dig deep into what the valuation really says.
- Despite a quick dip of 10.4% over the last week, Amkor's stock remains up an impressive 24.7% over the past year and has surged 128.5% over five years, hinting at both growth potential and heightened investor attention.
- Recently, the spotlight has been on Amkor as industry chatter picks up around supply chain improvements and expanding partnerships in automotive chips. These headlines have added new dimensions to market sentiment, setting the stage for fresh debates over what the company is really worth.
- On our valuation checks, Amkor scores a solid 3 out of 6, suggesting there is a real discussion to be had about its pricing. We'll break down what traditional valuation methods say, but stick around because by the end there is an even better way to connect the dots on what “fair value” means for Amkor.
Find out why Amkor Technology's 24.7% return over the last year is lagging behind its peers.
Approach 1: Amkor Technology Discounted Cash Flow (DCF) Analysis
The Discounted Cash Flow (DCF) model estimates what a company is truly worth by forecasting its future cash flows and then discounting those amounts back to today's dollars. For Amkor Technology, analysts look at both recent and future free cash flow (FCF) to understand the potential of the business and assess the share price.
Currently, Amkor Technology generates Free Cash Flow of $230.4 million. Analysts expect this figure to grow moderately over time, with projections reaching $257.4 million by the end of 2028. Beyond that, further estimates out to 2035, using trend extrapolation, see annual free cash flow numbers climbing as high as $390.0 million. These forecasts incorporate both analyst consensus for the next five years and continued, but slightly slowing, growth further out.
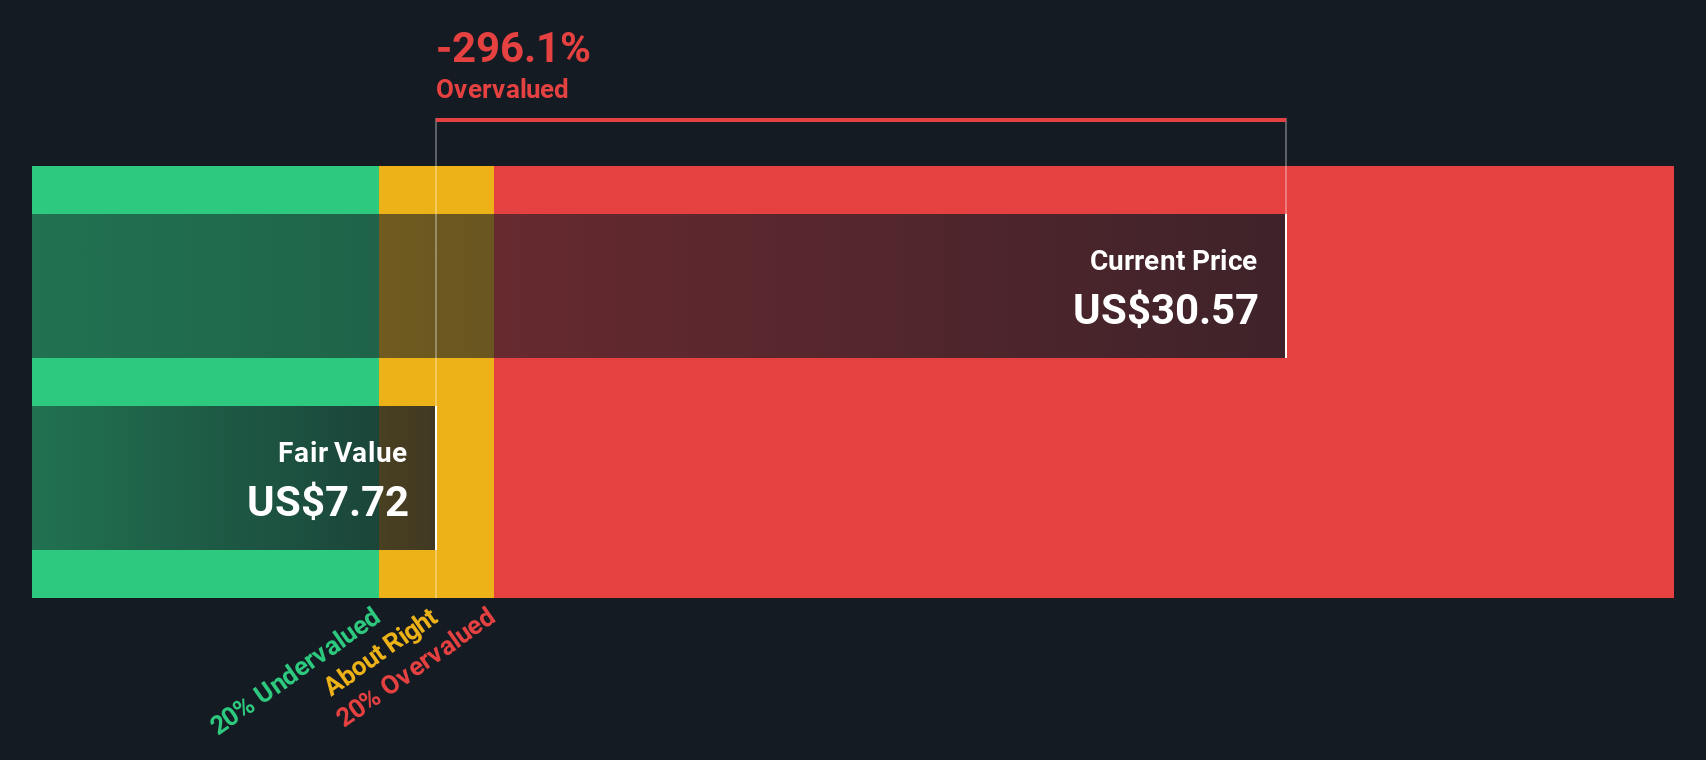
After running these cash flows through the DCF formula, the model estimates Amkor's intrinsic value at $12.00 per share. Compared to the current market price, this implies the stock is 156.4% overvalued relative to its forecast cash flows.
Result: OVERVALUED
Our Discounted Cash Flow (DCF) analysis suggests Amkor Technology may be overvalued by 156.4%. Discover 908 undervalued stocks or create your own screener to find better value opportunities.
Approach 2: Amkor Technology Price vs Earnings
For profitable companies like Amkor Technology, the price-to-earnings (PE) ratio is a go-to valuation tool because it tells us how much investors are willing to pay for each dollar of earnings. Since Amkor has a consistent pattern of profitability, the PE ratio gives a relevant checkpoint for its market pricing.
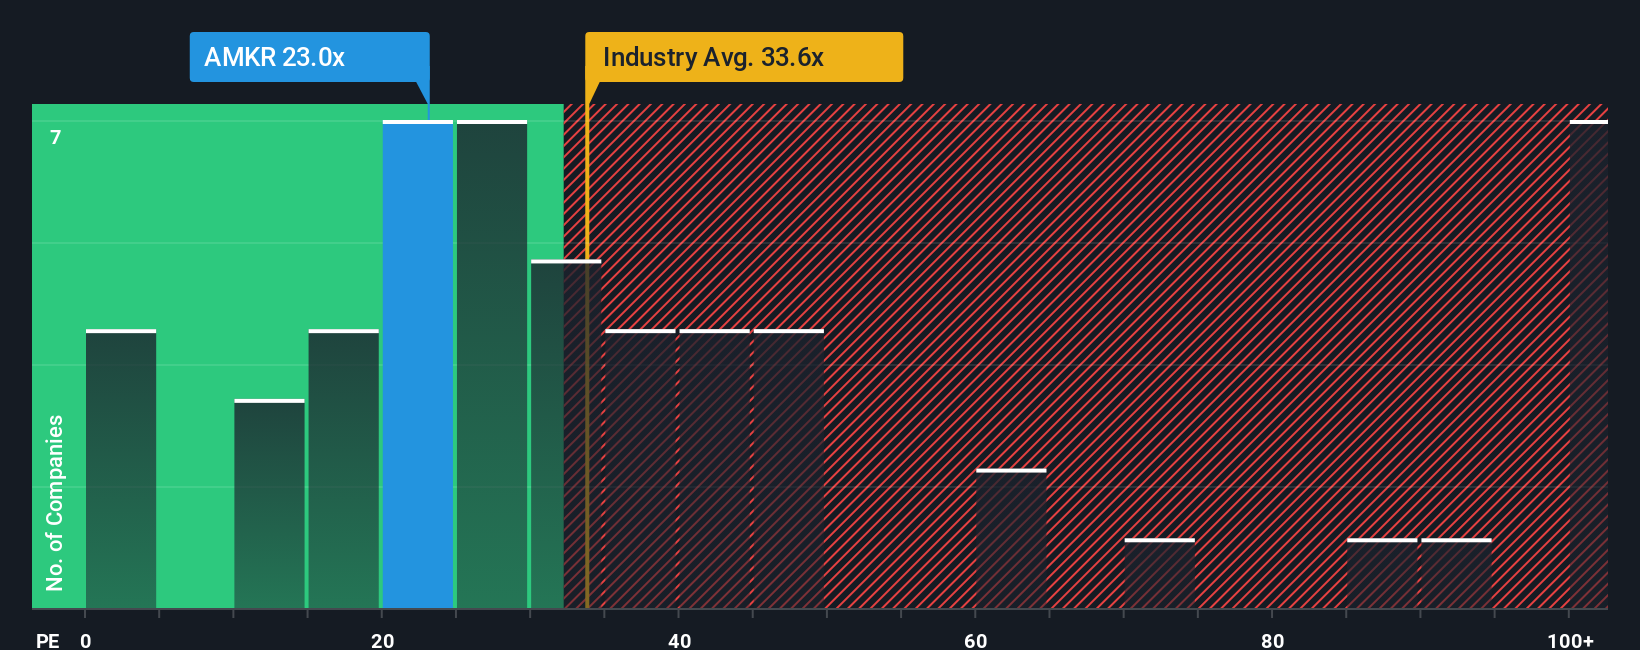
Growth expectations and risk play a big part in shaping what a “normal” or “fair” PE ratio should be. If a company’s earnings are expected to rise quickly, or risks are relatively low, investors may justify a higher PE. Comparisons become even more meaningful when we look at typical benchmarks: Amkor is currently trading on a PE of 24.6x. That compares with the semiconductor industry average of 33.6x and the average of direct peers at 35.3x.
Simply Wall St’s proprietary “Fair Ratio” takes this a step further. By weighing up Amkor’s earnings growth, profit margins, market cap, industry outlook, and specific risk profile, it calculates a PE of 32.9x as a more tailored benchmark. This goes beyond a plain comparison to industry or peer groups by accounting for the nuances that generic averages tend to miss, providing a fairer measure of value.
With Amkor’s current PE at 24.6x and the Fair Ratio at 32.9x, there is a notable gap in Amkor’s favor, suggesting the stock is undervalued versus what it should command given its fundamentals.
Result: UNDERVALUED
PE ratios tell one story, but what if the real opportunity lies elsewhere? Discover 1420 companies where insiders are betting big on explosive growth.
Upgrade Your Decision Making: Choose your Amkor Technology Narrative
Earlier we mentioned that there is an even better way to understand valuation, so let's introduce you to Narratives. Narratives are a simple, powerful tool that let you layer your personal view or story onto a number like fair value by building on your own forecasts for revenue, earnings, and margins. Instead of only looking at static numbers, Narratives give you the context behind those numbers and connect Amkor Technology’s unique business story to a live forecast and then a calculated fair value.
Available within the Community page on Simply Wall St, Narratives let millions of investors share their perspective and see others’ views quickly. When you compare a Narrative's fair value with the market price, you can better decide if it is time to buy, sell, or wait. Narratives are dynamic and update automatically when crucial news, financials, or company results are released so your outlook is always relevant.
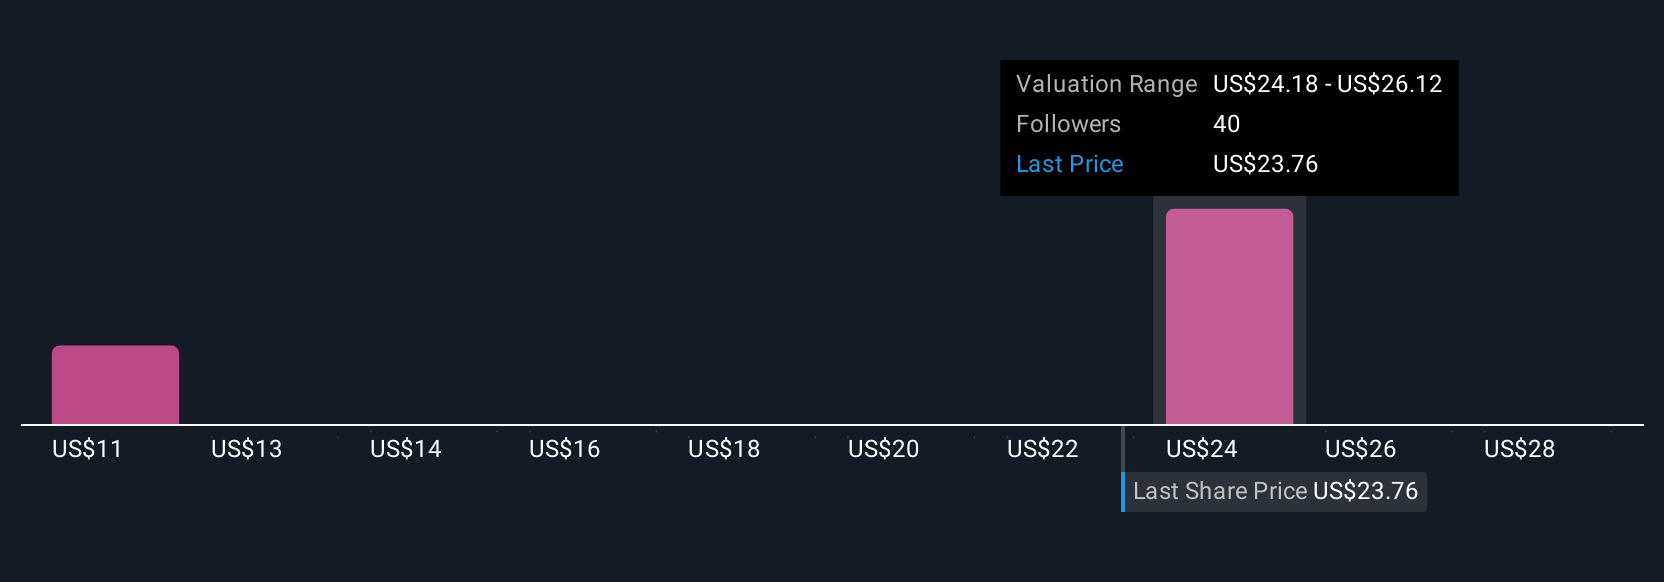
For Amkor Technology, one investor’s Narrative might see a fair value of $40 per share, expecting rapid automotive market expansion, while another’s could estimate just $12, citing intensifying competition. With Narratives, you can weigh these opinions against your own and make a smarter, more confident investment decision.
Do you think there's more to the story for Amkor Technology? Head over to our Community to see what others are saying!
This article by Simply Wall St is general in nature. We provide commentary based on historical data and analyst forecasts only using an unbiased methodology and our articles are not intended to be financial advice. It does not constitute a recommendation to buy or sell any stock, and does not take account of your objectives, or your financial situation. We aim to bring you long-term focused analysis driven by fundamental data. Note that our analysis may not factor in the latest price-sensitive company announcements or qualitative material. Simply Wall St has no position in any stocks mentioned.
Have feedback on this article? Concerned about the content? Get in touch with us directly. Alternatively, email editorial-team@simplywallst.com