
- LIVE QUOTES
- LEARN
- HELP
 Nasdaq
 Wall Street Journal
EN
How S&P Global’s Latest Acquisitions Impact Its Current Valuation
- Curious if S&P Global is a value play or overpriced at these levels? Whether you are a long-term investor or just looking for your next smart move, understanding the real value behind the stock is key.
- Shares have recently nudged higher, up 3.6% over the past month and 3.1% over the last year, hinting that the market still sees long-term growth potential and perhaps a shift in sentiment.
- Recent headlines have focused on S&P Global's continued strategic acquisitions in the data and analytics space, bolstering its global reach and enhancing its product ecosystem. These developments have contributed to the positive buzz and provided the backdrop for the latest shifts in the company's stock price.
- On traditional valuation checks, S&P Global only scores 1 out of 6, meaning it is currently undervalued in just one key metric. Let's unpack what goes into that score and why there might be a more insightful approach to valuation that investors should consider by the end of this article.
S&P Global scores just 1/6 on our valuation checks. See what other red flags we found in the full valuation breakdown.
Approach 1: S&P Global Excess Returns Analysis
The Excess Returns valuation approach looks at how much profit a company is able to generate above its cost of equity capital, based on its returns on invested capital and growth expectations. This model focuses less on cash flows and more on the company's ability to consistently earn returns that outpace what investors require.
For S&P Global, the model incorporates the following projections:
- Book Value: $109.21 per share
- Stable Earnings Per Share (EPS): $19.06 per share
(Source: Weighted future Return on Equity estimates from 5 analysts.) - Cost of Equity: $9.28 per share
- Excess Return: $9.78 per share
- Average Return on Equity: 16.89%
- Stable Book Value: $112.81 per share
(Source: Weighted future Book Value estimates from 5 analysts.)
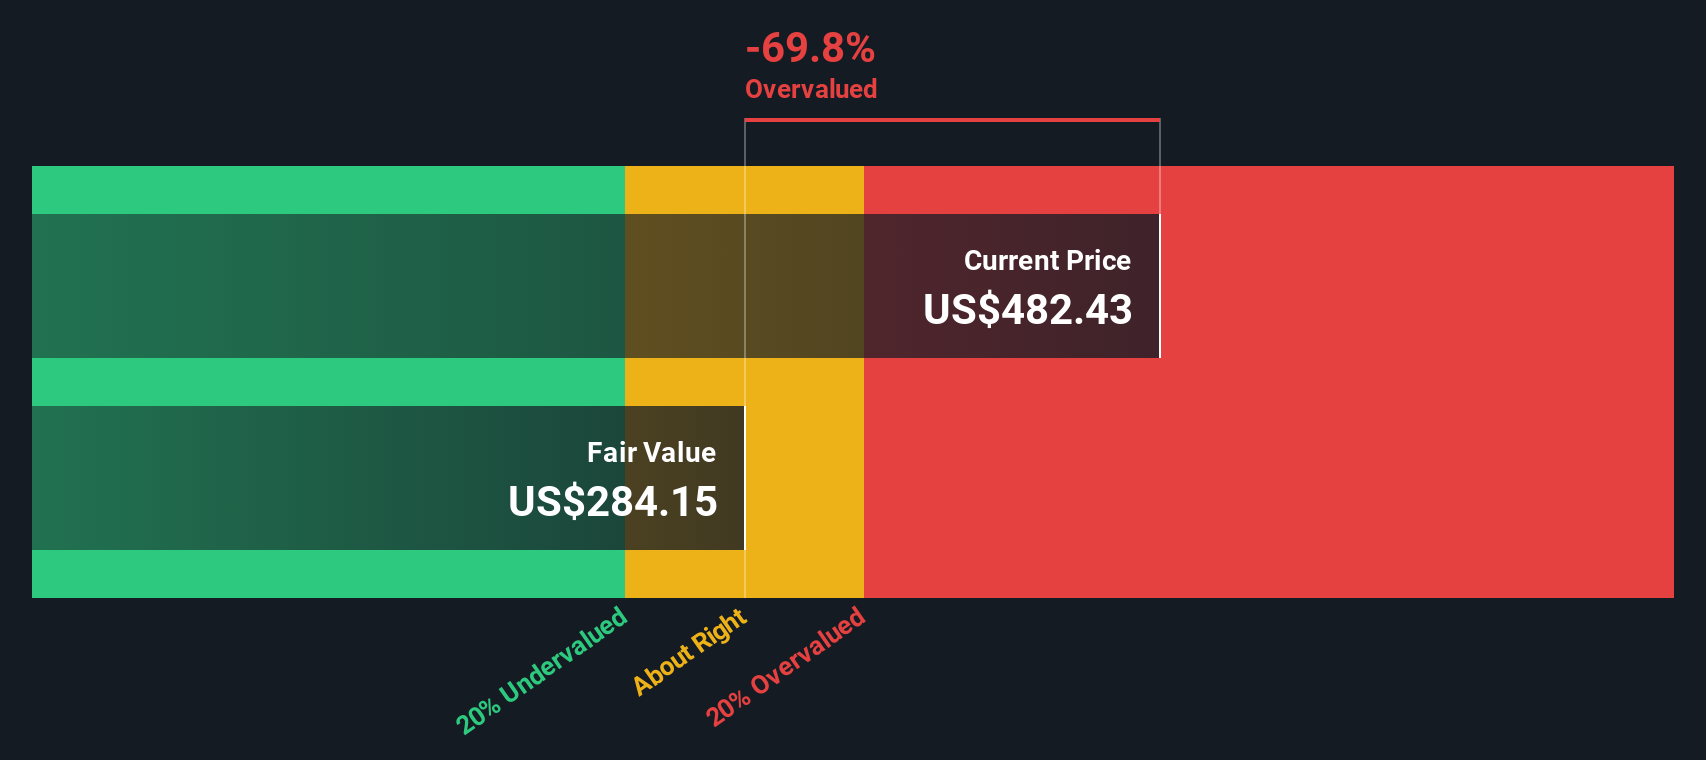
According to the Excess Returns model, S&P Global’s long-term capacity to generate high returns over its cost of capital is strong. However, the estimated intrinsic value from this method implies that the stock is currently 64.1% overvalued compared to its current price.
Result: OVERVALUED
Our Excess Returns analysis suggests S&P Global may be overvalued by 64.1%. Discover 842 undervalued stocks or create your own screener to find better value opportunities.
Approach 2: S&P Global Price vs Earnings
The Price-to-Earnings (PE) ratio is a widely used metric to value established, profitable companies like S&P Global. It tells investors how much they are paying for each dollar of earnings, which is especially useful for companies with consistent profits and transparent earnings performance.
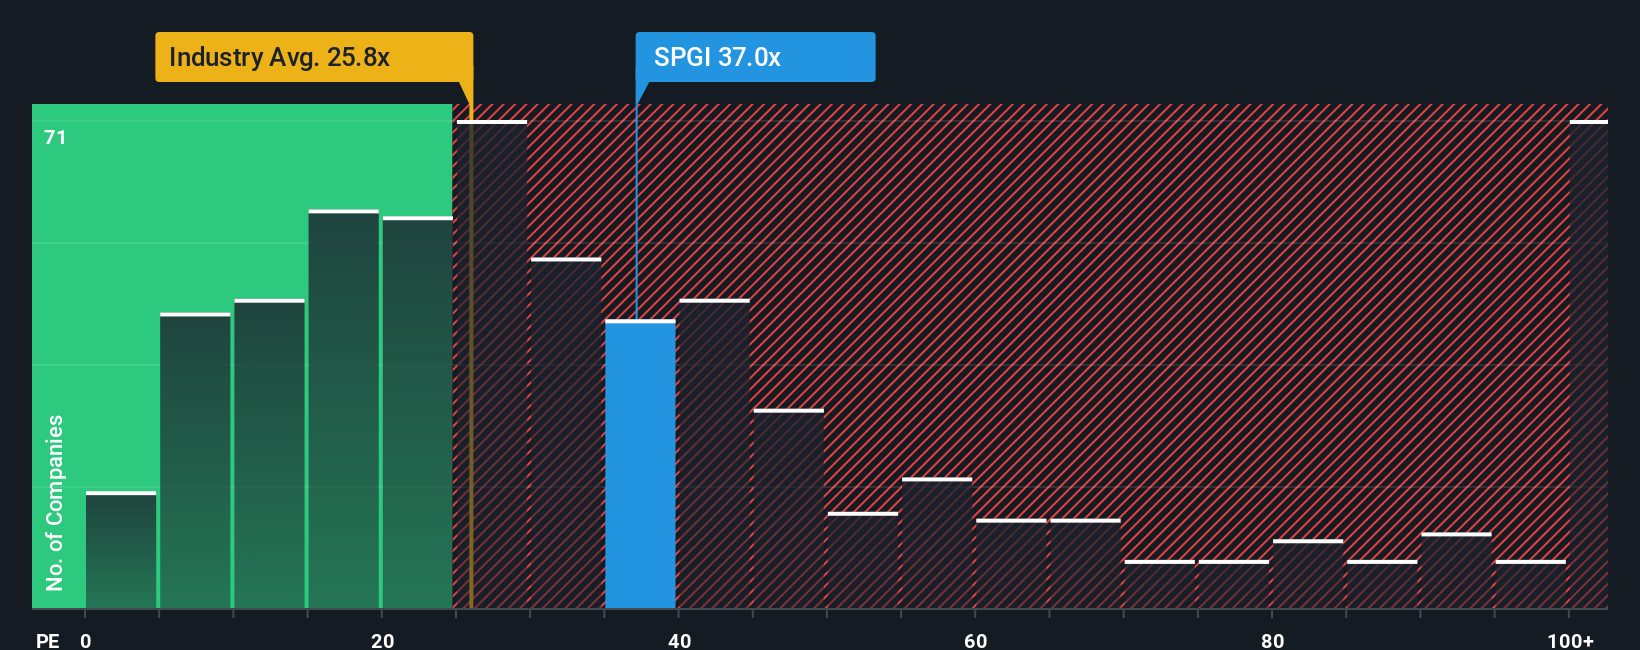
What is considered a “fair” PE ratio depends on a range of factors. Higher expected earnings growth and lower risk typically justify a higher PE. In contrast, slow-growing or riskier companies often deserve a lower PE. The market benchmarks S&P Global against the Capital Markets industry average PE of 24.25x as well as its peer group average of 29.55x.
Currently, S&P Global trades at a PE ratio of 35.69x. This is notably higher than both the industry and peer averages. However, Simply Wall St’s proprietary “Fair Ratio” model accounts for not only growth but also factors such as profit margins, risk, industry trends, and the company’s market cap. For S&P Global, the Fair Ratio is calculated to be 18.17x. Unlike simple peer or industry comparisons, this Fair Ratio offers a more holistic perspective on what the multiple should be, given the company’s specific financial profile and future outlook.
Comparing the actual PE of 35.69x to the Fair Ratio of 18.17x, S&P Global is trading at a premium that cannot be fully explained by fundamentals or expected growth. This suggests the shares are overvalued on a Price-to-Earnings basis.
Result: OVERVALUED
PE ratios tell one story, but what if the real opportunity lies elsewhere? Discover 1411 companies where insiders are betting big on explosive growth.
Upgrade Your Decision Making: Choose your S&P Global Narrative
Earlier we mentioned that there is an even better way to understand valuation, so let’s introduce you to Narratives. A Narrative is your personal story and perspective on a company, connecting what you believe about S&P Global’s future with your chosen forecasts for its revenue, earnings, and profit margins. Narratives make it simple to link a company’s story to concrete financial forecasts and, ultimately, to an estimated fair value.
Available right on Simply Wall St’s Community page and used by millions of investors, Narratives empower you to see how your assumptions measure up, and whether you think S&P Global is mispriced. When new news or earnings are released, Narratives update automatically so your view remains current. By comparing Fair Value to the current Price, Narratives help you decide when to buy, sell, or hold based on what you believe, not just the crowd’s opinion. For example, some investors see S&P Global’s fair value far above today’s price by forecasting faster growth, while others estimate much lower fair values due to more cautious assumptions. All of this is available within the same easy-to-use tool.
Do you think there's more to the story for S&P Global? Head over to our Community to see what others are saying!
This article by Simply Wall St is general in nature. We provide commentary based on historical data and analyst forecasts only using an unbiased methodology and our articles are not intended to be financial advice. It does not constitute a recommendation to buy or sell any stock, and does not take account of your objectives, or your financial situation. We aim to bring you long-term focused analysis driven by fundamental data. Note that our analysis may not factor in the latest price-sensitive company announcements or qualitative material. Simply Wall St has no position in any stocks mentioned.
Have feedback on this article? Concerned about the content? Get in touch with us directly. Alternatively, email editorial-team@simplywallst.com