
- LIVE QUOTES
- LEARN
- HELP
 Nasdaq
 Wall Street Journal
EN
Assessing ICON Stock After a 22% Drop and Fresh Valuation Insights for 2025
- Ever found yourself wondering if ICON stock is a hidden opportunity or just another name on the NASDAQ? Let’s break down what’s really going on before diving into the numbers.
- ICON’s stock price has dropped significantly over the last year, with a 22.0% decline, and a further 19.2% decrease year-to-date. This has prompted debate about whether the stock represents a potential turnaround or a value trap.
- The latest moves come amid broader market shifts in the life sciences sector and notable M&A activity surrounding some of ICON’s competitors. These factors have contributed to volatility and changed how investors assess risk and rewards for the company.
- On the valuation front, ICON scores an impressive 6 out of 6 on our value checks, which is rare. We will review what each valuation method indicates in just a moment, but there is another approach to understanding fair value that will be revealed at the end of this article.
Find out why ICON's -22.0% return over the last year is lagging behind its peers.
Approach 1: ICON Discounted Cash Flow (DCF) Analysis
The Discounted Cash Flow (DCF) model estimates a company’s intrinsic value by projecting its future cash flows and discounting them back to their present value, using a rate that reflects the financial risk. In the case of ICON, analysts begin by considering its current Free Cash Flow (FCF), which stands at $980.9 Million. Over the next five years, FCF is expected to grow, with projections reaching $1.15 Billion by the end of 2029. It is important to note that while analyst forecasts are available for the next few years, projections for further years are calculated by Simply Wall St for a complete ten-year outlook.
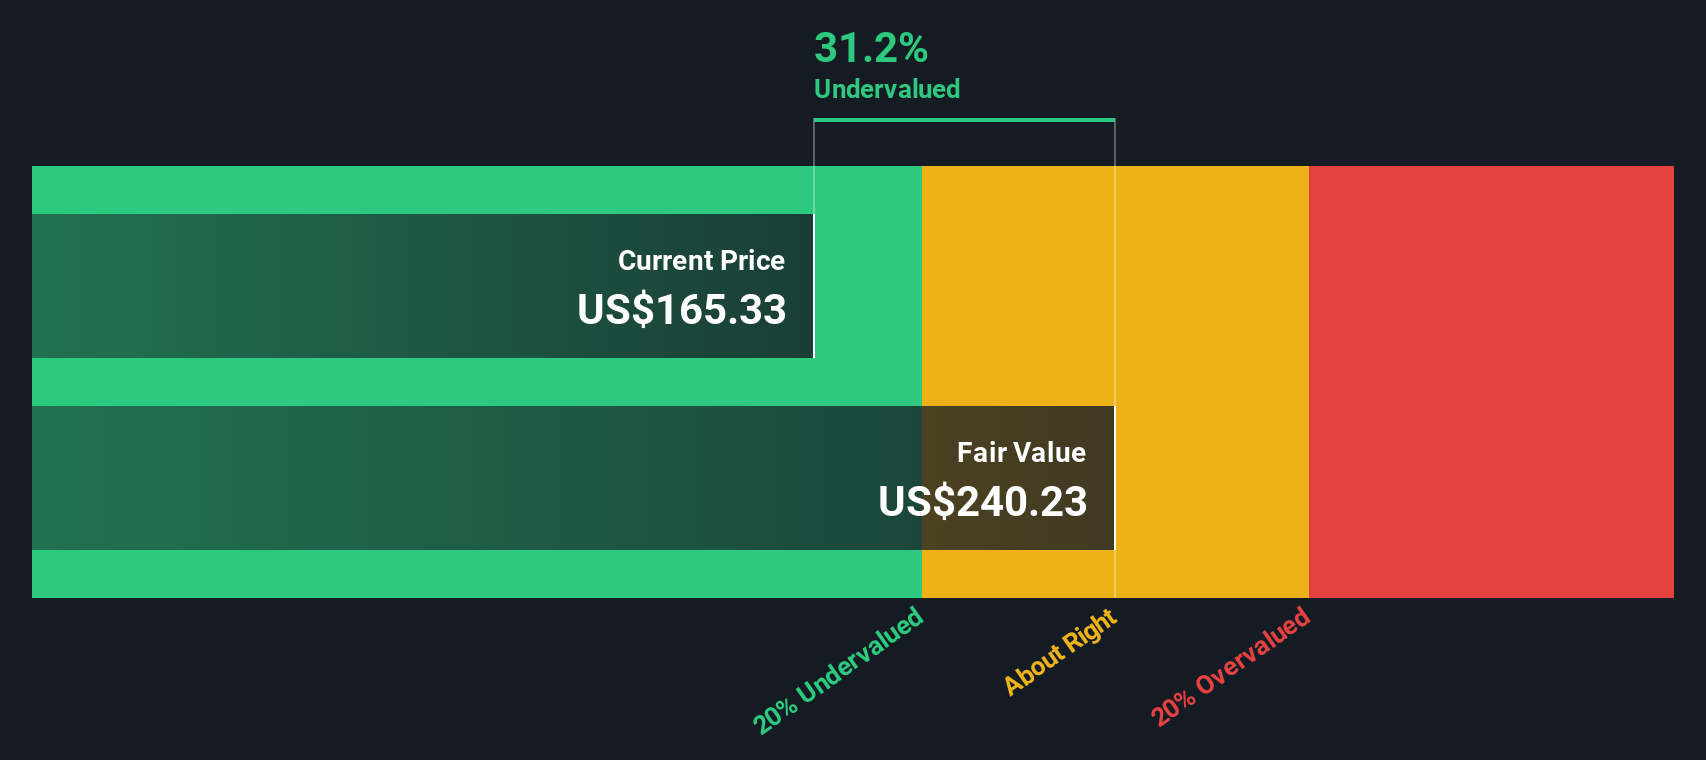
By applying this method, the model estimates ICON’s intrinsic value at $240.51 per share. This figure is based on the company’s improving cash flow and the broader financial outlook. With ICON currently trading at a 28.6% discount to this intrinsic value, the DCF model suggests the stock is significantly undervalued after a year of price declines.
Result: UNDERVALUED
Our Discounted Cash Flow (DCF) analysis suggests ICON is undervalued by 28.6%. Track this in your watchlist or portfolio, or discover 840 more undervalued stocks based on cash flows.
Approach 2: ICON Price vs Earnings
The Price-to-Earnings (PE) ratio is considered the best valuation metric for profitable companies like ICON because it directly relates a company’s market value to its actual earnings. A lower PE can indicate a stock is undervalued, provided those earnings are sustainable. A higher PE reflects greater investor expectations for growth or reduced perceived risk.
Growth prospects, business stability and sector risk all play a role in determining what constitutes a “normal” or “fair” PE ratio. Companies expected to grow faster or deliver steadier profits often command higher PEs. Riskier or slower-growth firms typically trade at lower multiples.
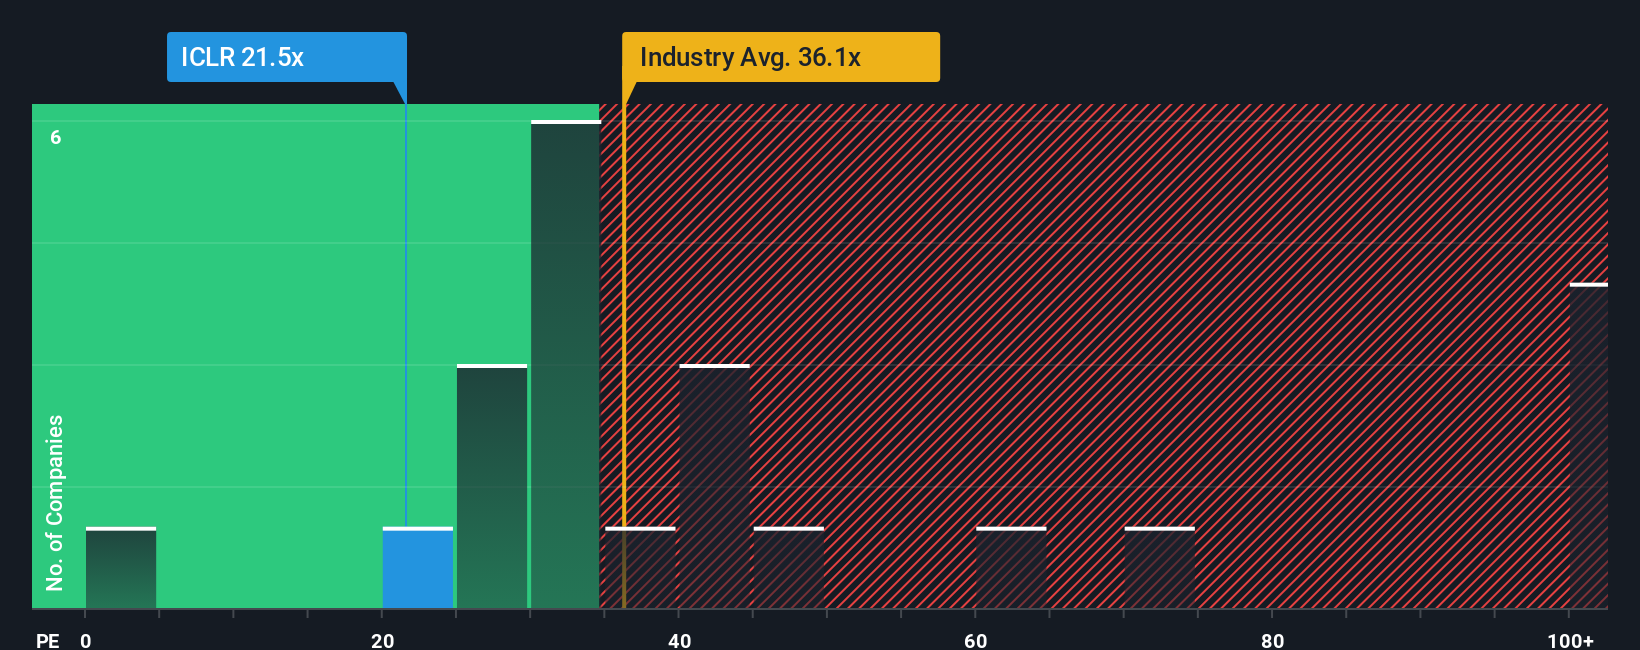
Currently, ICON trades at a PE of 21.9x. This is well below the Life Sciences industry average of 39.2x and also trails the peer group average of 62.0x. While this looks attractive on the surface, headline comparisons can mask important differences in company-specific growth, profitability and size. That is where Simply Wall St's proprietary “Fair Ratio” comes in. For ICON, the Fair PE is calculated at 24.2x, factoring in its growth outlook, sector, profit margins, market capitalization, and company-specific risk factors.
The Fair Ratio offers a more tailored benchmark than industry or peer averages, reflecting the unique aspects of ICON rather than a one-size-fits-all approach. When comparing ICON’s actual PE of 21.9x with its Fair Ratio of 24.2x, the stock appears to be attractively valued on an earnings basis.
Result: UNDERVALUED
PE ratios tell one story, but what if the real opportunity lies elsewhere? Discover 1414 companies where insiders are betting big on explosive growth.
Upgrade Your Decision Making: Choose your ICON Narrative
Earlier, we mentioned there’s an even better way to understand valuation, so let's introduce you to Narratives. A Narrative is your personalized story about a company, where you connect the dots between what you believe about ICON’s future and how that shapes your forecast for revenue, earnings, margins, and fair value. Instead of just using static numbers, Narratives capture your perspective and assumptions, tying them directly to a financial forecast and resulting valuation.
Narratives offer a powerful, accessible tool available on Simply Wall St's Community page, trusted by millions of investors. With Narratives, you can articulate your thesis on ICON’s outlook, adjust your estimates, and see how your fair value compares to today’s market price. This approach helps you make confident decisions on your investment timing. Because Narratives update dynamically as new information arrives, they keep pace with news, financial results, and fresh insights, ensuring your investment view stays relevant.
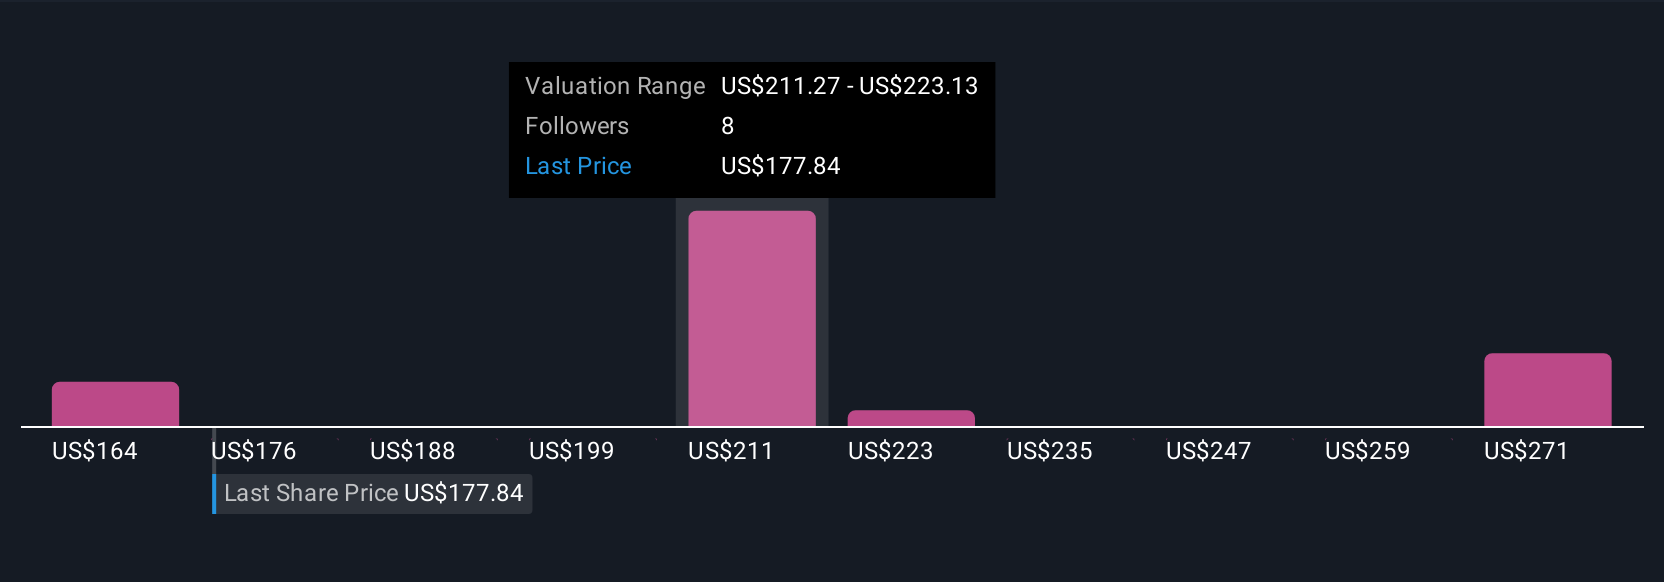
For example, with ICON, the most optimistic Narrative expects record revenue and margin gains from AI tool adoption and aggressive share buybacks, supporting a bullish fair value near $243. In contrast, the most cautious Narrative factors in margin pressures and weak bookings and arrives at a significantly lower value of $180. This demonstrates how different stories and assumptions can lead to different investment conclusions.
Do you think there's more to the story for ICON? Head over to our Community to see what others are saying!
This article by Simply Wall St is general in nature. We provide commentary based on historical data and analyst forecasts only using an unbiased methodology and our articles are not intended to be financial advice. It does not constitute a recommendation to buy or sell any stock, and does not take account of your objectives, or your financial situation. We aim to bring you long-term focused analysis driven by fundamental data. Note that our analysis may not factor in the latest price-sensitive company announcements or qualitative material. Simply Wall St has no position in any stocks mentioned.
Have feedback on this article? Concerned about the content? Get in touch with us directly. Alternatively, email editorial-team@simplywallst.com