
- LIVE QUOTES
- LEARN
- HELP
 Nasdaq
 Wall Street Journal
EN
Assessing MSCI Stock After 8.5% Jump and Expansion Into ESG Solutions
- Curious if MSCI stock is a good value right now? The story is more nuanced than simply looking at the current share price or headline news.
- MSCI has attracted attention recently with its share price rising 8.5% in the last week and 6.5% over the past month, despite being slightly down for the year so far at -1.4%.
- Recent headlines have highlighted MSCI's expansion into new ESG offerings and the increasing demand for its risk analytics solutions, which has contributed to optimism among investors. At the same time, broader market volatility has added another layer of interest to the stock's movements.
- MSCI currently scores 0 out of 6 on our value check, indicating it is not considered undervalued on any of our six tested metrics. Next, we will explore those valuation approaches in detail and, before concluding, discuss a broader way of thinking about valuation that extends beyond the numbers.
MSCI scores just 0/6 on our valuation checks. See what other red flags we found in the full valuation breakdown.
Approach 1: MSCI Discounted Cash Flow (DCF) Analysis
The Discounted Cash Flow (DCF) valuation approach projects how much free cash MSCI is expected to generate in the future, and then discounts those cash flows back to today's value to estimate what the company is intrinsically worth. This method essentially answers the question, "What is all of MSCI's future cash flow worth in today's dollars?"
Currently, MSCI generates around $1.4 billion in Free Cash Flow (FCF). Analysts expect this number to steadily grow, with estimates suggesting FCF could reach roughly $2.1 billion by 2029. Beyond that, additional projections based on growth estimates from Simply Wall St extend out to 2035, indicating continued growth but at a slowing rate. These long-term assumptions are extrapolated since analyst coverage usually only extends about five years.
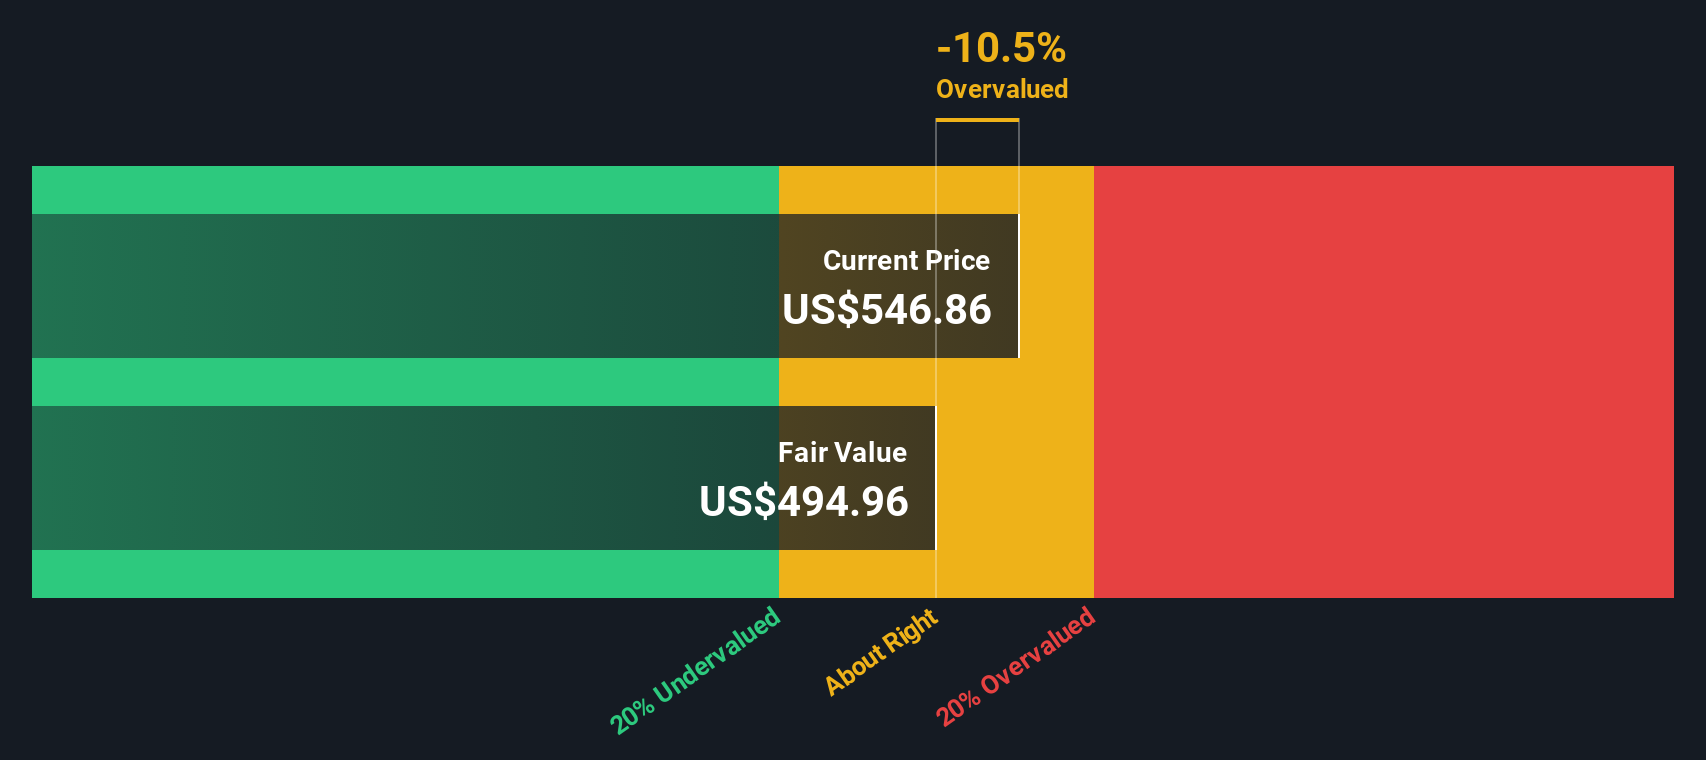
According to the DCF result, MSCI's fair value is estimated at $516.57 per share. However, this represents a 13.9% premium to the current share price, meaning the stock trades above what the projection considers to be its intrinsic worth. This suggests that, based on cash flow alone, MSCI may now be overvalued by the market.
Result: OVERVALUED
Our Discounted Cash Flow (DCF) analysis suggests MSCI may be overvalued by 13.9%. Discover 832 undervalued stocks or create your own screener to find better value opportunities.
Approach 2: MSCI Price vs Earnings
The Price-to-Earnings (PE) ratio is one of the most widely used tools to value profitable companies like MSCI, because it directly compares the company’s stock price to the actual earnings it generates. Since MSCI consistently posts positive earnings, using the PE ratio gives a straightforward picture of how much investors are willing to pay for each dollar of profit.
What counts as a “normal” or “fair” PE ratio can vary based on how quickly a company is expected to grow, how risky its earnings are, and overall market sentiment. Fast-growing or lower-risk companies generally command higher PE multiples, while slower or riskier businesses trade at lower multiples.
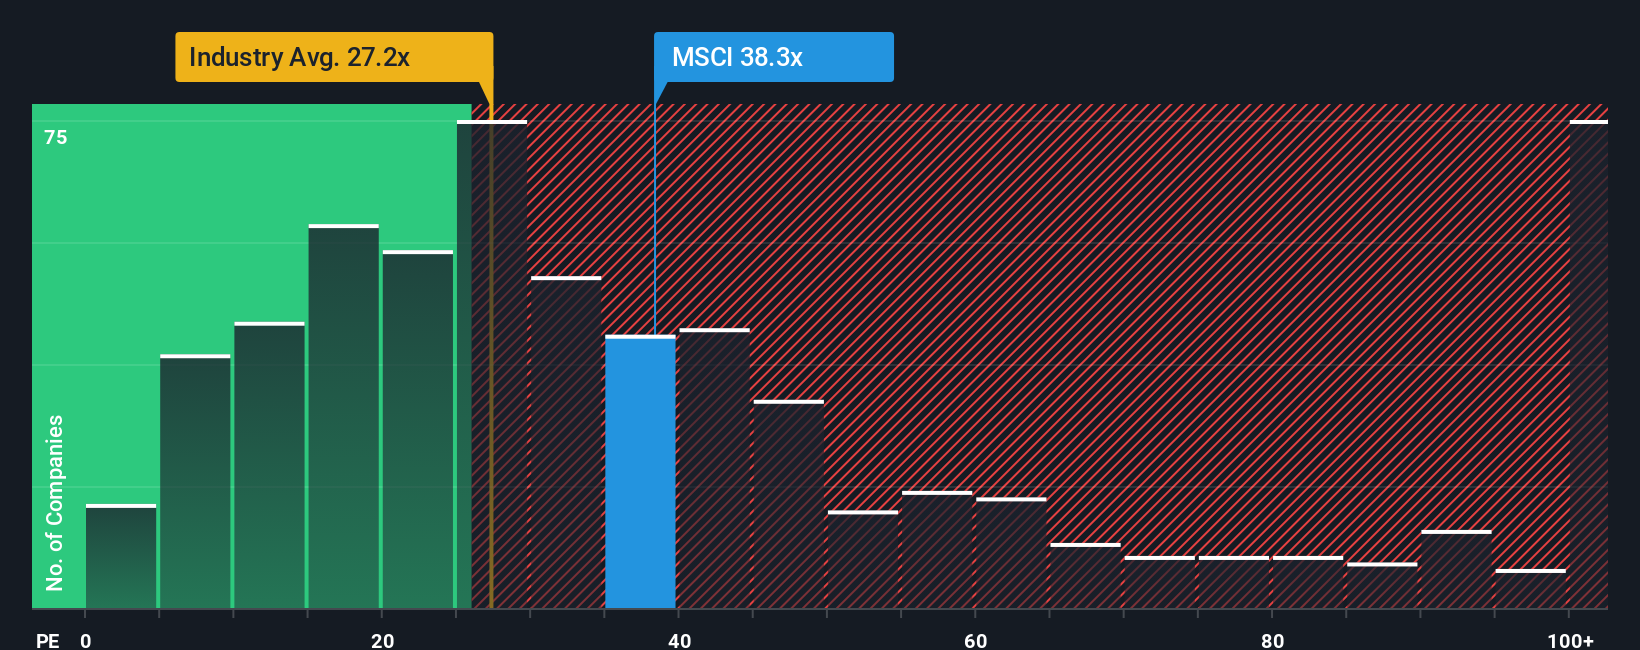
Currently, MSCI’s PE ratio stands at 36.16x, which is higher than the Capital Markets industry average of 25.09x and its peer group average of 33.16x. This might initially suggest MSCI is expensive relative to its sector. However, Simply Wall St’s Fair Ratio, a proprietary assessment that considers not just industry averages but also MSCI’s unique earnings growth, profit margin, market cap, and risk profile, estimates a fair PE multiple of 18.24x for MSCI.
The Fair Ratio goes beyond what peers or industries alone can show, painting a more complete valuation picture by incorporating growth potential and company-specific strengths or weaknesses. When we compare MSCI’s actual PE to its Fair Ratio, the gap is significant, indicating the stock is trading well above what its fundamentals might justify.
Result: OVERVALUED
PE ratios tell one story, but what if the real opportunity lies elsewhere? Discover 1410 companies where insiders are betting big on explosive growth.
Upgrade Your Decision Making: Choose your MSCI Narrative
Earlier we mentioned that there is an even better way to understand valuation, so let's introduce you to Narratives. A Narrative is your own unique story about a company, connecting what you believe about its future growth, earnings, and margins to a financial forecast and a resulting fair value. Narratives help you look beyond static numbers by embedding your perspective on MSCI's business model, its risks, and potential growth drivers into the actual valuation calculation.
Available on Simply Wall St's Community page and used by millions of investors, Narratives are accessible, dynamic tools that let you test out "what if" scenarios and see how changes in news, earnings, or industry developments could alter your view of MSCI's fair value. This empowers you to decide for yourself when the current price offers an attractive opportunity compared to your own fair value estimate.
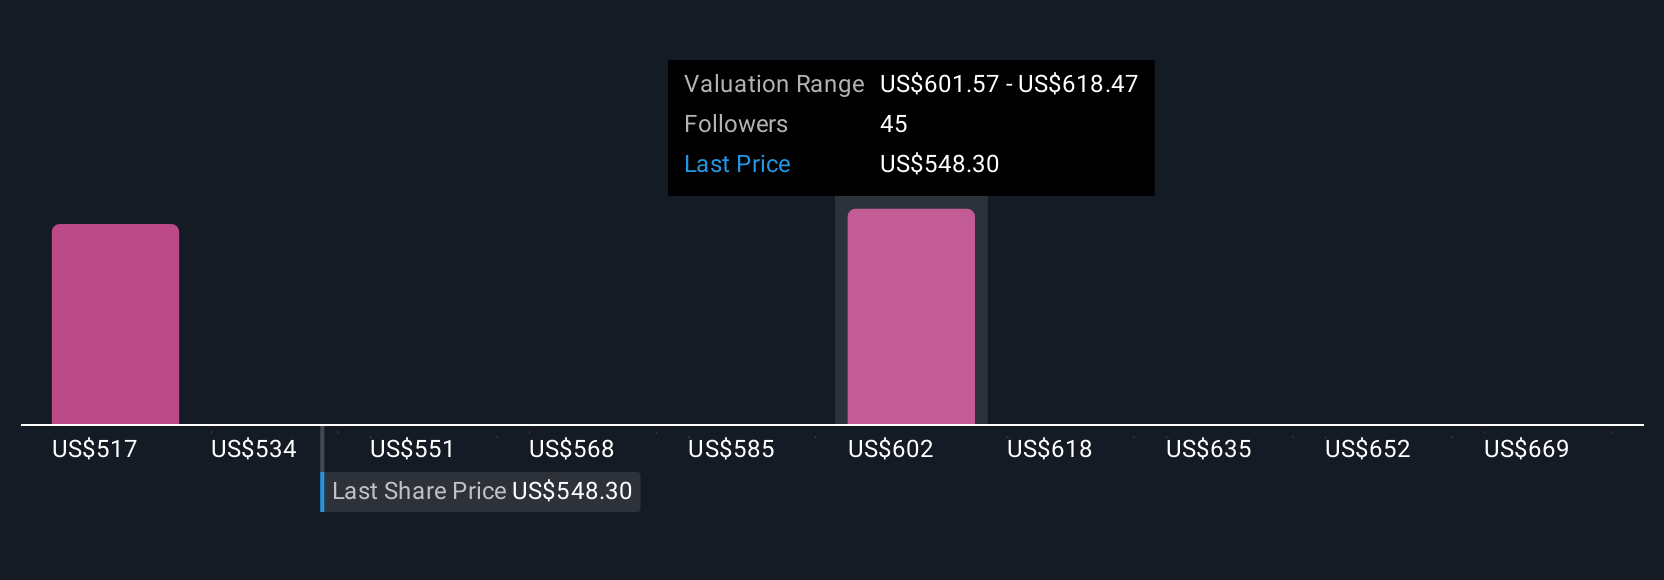
For example, some investors might view MSCI as offering durable recurring revenues, wide margins, and continued pricing power, which could lead them to set a higher fair value, supported by bullish analyst price targets of $700. Others might be more cautious about fee compression and competition, setting their fair value closer to the most bearish estimate of $520. Narratives help you see and act on both sides, making your investment process more personal and resilient as news and numbers change.
Do you think there's more to the story for MSCI? Head over to our Community to see what others are saying!
This article by Simply Wall St is general in nature. We provide commentary based on historical data and analyst forecasts only using an unbiased methodology and our articles are not intended to be financial advice. It does not constitute a recommendation to buy or sell any stock, and does not take account of your objectives, or your financial situation. We aim to bring you long-term focused analysis driven by fundamental data. Note that our analysis may not factor in the latest price-sensitive company announcements or qualitative material. Simply Wall St has no position in any stocks mentioned.
Have feedback on this article? Concerned about the content? Get in touch with us directly. Alternatively, email editorial-team@simplywallst.com