
- LIVE QUOTES
- LEARN
- HELP
 Nasdaq
 Wall Street Journal
EN
What Do Recent Partnerships Mean for Harmonic’s True Value in 2025?
- Thinking of investing in Harmonic but want to know if you're getting a good deal? Let's break down what might make this stock a value play or not.
- The stock has shown recent signs of life, rising 2.4% in the last week and 4.6% over the past month. However, it is still down 18.6% year-to-date.
- Much of the recent price movement comes after industry-wide optimism about streaming technology and a series of partnerships announced by Harmonic. These developments have helped boost sentiment, and investors are taking notice, hoping they could translate into longer-term growth and potentially shift the company's risk profile.
- On our valuation checks, Harmonic scores a 3/6. This means it appears undervalued in half of the main metrics we review. We'll get into the details of how these scores are calculated in a moment, but stay with us for a more insightful way to judge true value coming up at the end of this article.
Find out why Harmonic's -4.0% return over the last year is lagging behind its peers.
Approach 1: Harmonic Discounted Cash Flow (DCF) Analysis
The Discounted Cash Flow (DCF) model works by projecting a company’s future free cash flows and then discounting them back to today’s value to estimate what the business is intrinsically worth. This method gives a sense of what the stock should be worth based on its future earnings potential, not just its current profits.
For Harmonic, the current Free Cash Flow stands at $119.2 Million, highlighting a healthy level of cash generation. According to analyst estimates and model extrapolation, free cash flow in 2026 is projected to be $69.7 Million, with a decline over the next decade to around $35 Million by 2035. While analysts typically offer cash flow projections only a few years out, the model extends these estimates to provide a longer-term view.
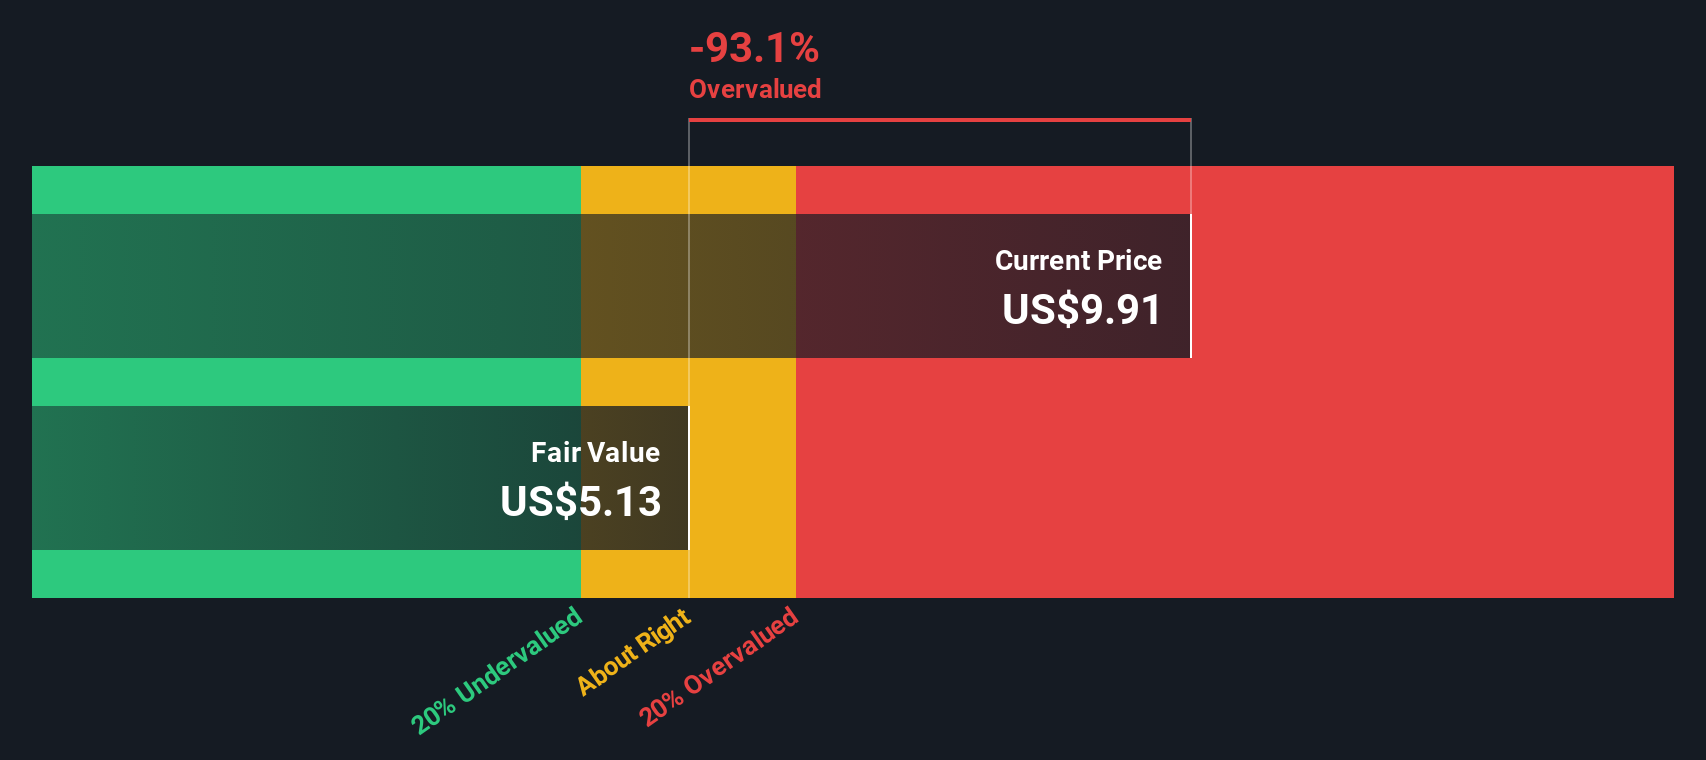
Based on these projections, Harmonic’s intrinsic value is calculated as $5.15 per share. With the current share price at more than double this figure, the DCF model indicates the stock is about 107% overvalued at this time.
Result: OVERVALUED
Our Discounted Cash Flow (DCF) analysis suggests Harmonic may be overvalued by 107.0%. Discover 839 undervalued stocks or create your own screener to find better value opportunities.
Approach 2: Harmonic Price vs Earnings
For profitable companies like Harmonic, the Price-to-Earnings (PE) ratio is one of the most widely used methods for stock valuation. The PE ratio reflects how much investors are willing to pay for each dollar of the company’s earnings, making it a practical gauge of market sentiment and perceived potential.
Typically, a company with strong growth prospects or lower risk will command a higher PE ratio, while those facing uncertainty warrant a lower multiple. Factors such as expected earnings growth, profitability, and industry trends all play crucial roles in shaping what is considered a “normal” or “fair” PE for a particular business.
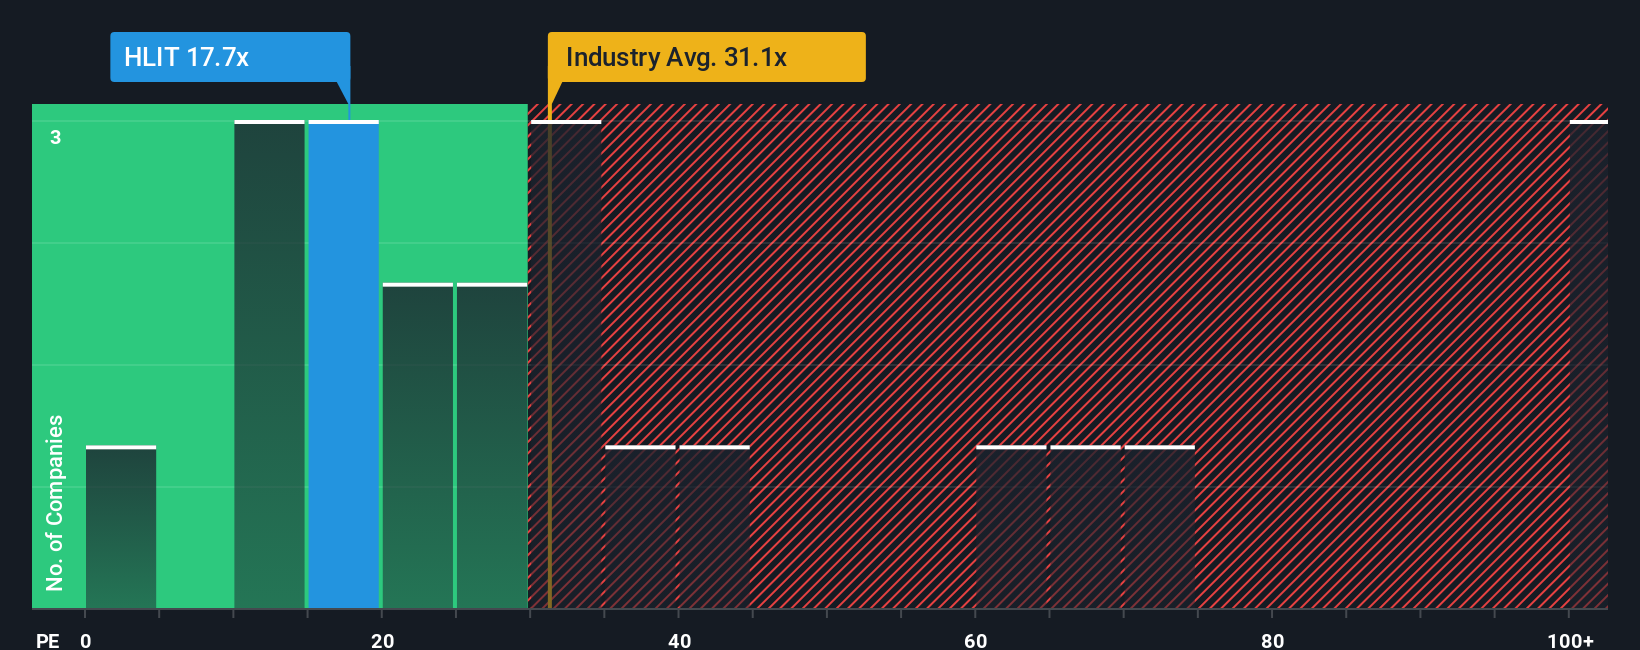
At present, Harmonic trades at a PE ratio of 17.6x. This is significantly below both the peer average of 28.9x and the communications industry average of 33.5x. This suggests the market is pricing in more caution or slower growth for Harmonic. However, Simply Wall St’s proprietary Fair Ratio model, which uniquely considers the company’s growth forecasts, profit margins, risks, industry, and market cap, calculates Harmonic’s fair PE at 22.9x. Unlike simply comparing to peers or industry, the Fair Ratio fine-tunes expectations to the individual company traits that matter most to investors.
With its current PE ratio of 17.6x compared to a Fair Ratio of 22.9x, Harmonic’s stock appears undervalued according to this approach.
Result: UNDERVALUED
PE ratios tell one story, but what if the real opportunity lies elsewhere? Discover 1391 companies where insiders are betting big on explosive growth.
Upgrade Your Decision Making: Choose your Harmonic Narrative
Earlier we mentioned that there is an even better way to understand valuation, so let us introduce you to Narratives. A Narrative is a simple, approachable tool that lets you create your own story about a company and connect it directly to a set of financial forecasts, such as fair value, future revenue, and margins, based on your own expectations or assumptions.
On Simply Wall St’s Community page, millions of investors use Narratives to review, refine, and share their perspectives, linking Harmonic’s latest business developments or competitive strengths directly to customized valuation models. This makes it easy to decide whether to buy or sell when comparing fair value against the current share price.
Narratives stay dynamic, automatically updating when new news emerges, earnings are reported, or company guidance changes, so your investment view never goes out of date.
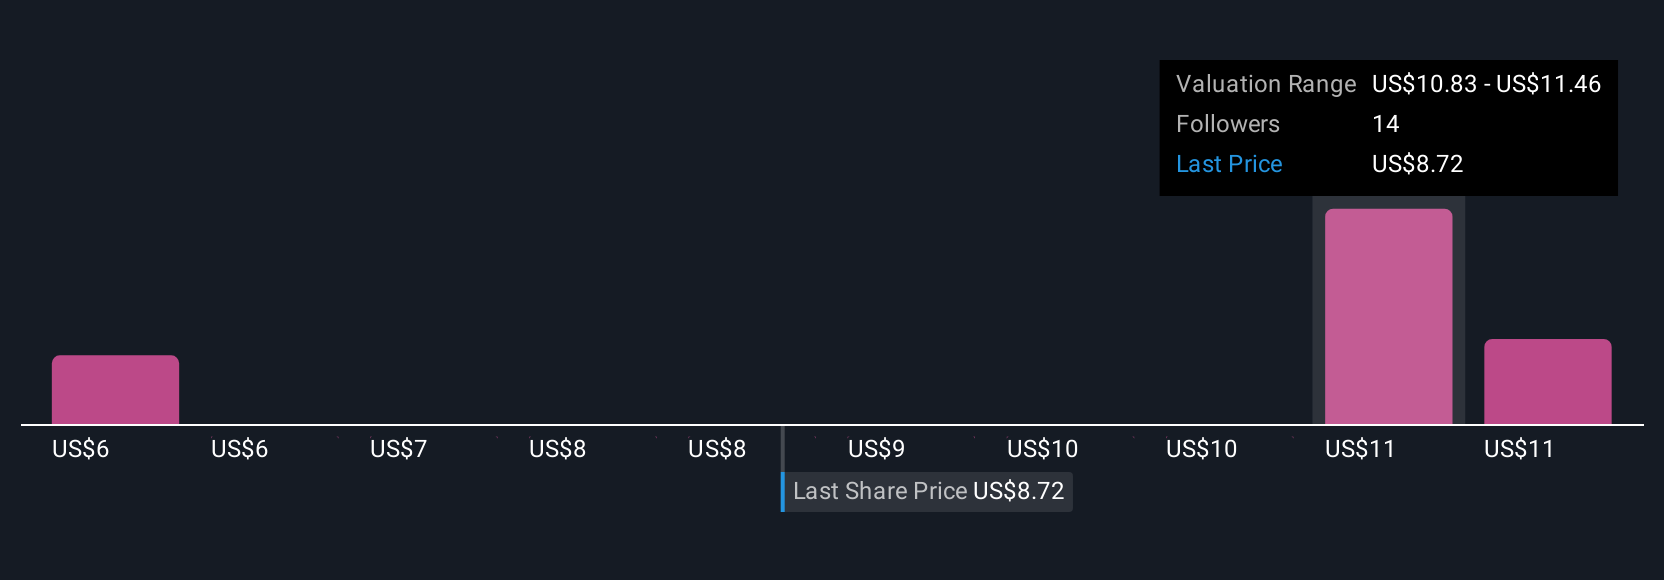
For example, one Harmonic Narrative might reflect a bullish view, projecting a fair value of $12.5 per share based on expanding broadband demand and recurring SaaS revenue. A more cautious Narrative might cite technology risks or customer concentration for a fair value of just $7.0 per share. Narratives let you choose which outlook best fits your beliefs and investment approach.
For Harmonic, we will make it easy for you with previews of two leading Harmonic Narratives:
- 🐂 Harmonic Bull Case
Fair Value: $12.10
Current Price is 12% below the narrative fair value
Revenue Growth Rate: 5.0%
- Highlights Harmonic’s strong positioning in the broadband and video delivery sectors, with Tier-1 telecom partnerships and a low price-to-earnings ratio compared to peers.
- There are significant tailwinds from broadband expansion, 5G deployment, and recurring SaaS/cloud revenue streams supporting multi-year growth.
- Cautions on execution risks and reliance on a few large customers, but notes the stock may offer a compelling mix of value and growth for a mid-term investment horizon.
- 🐻 Harmonic Bear Case
Fair Value: $10.50
Current Price is 1.4% above the narrative fair value
Revenue Growth Rate: 0.3%
- Emphasizes the risks from customer concentration, rapid technology changes, and increased competition, which may pressure revenues and margins.
- Harmonic’s shift to higher-margin SaaS and cloud products could drive future earnings, but the transition may introduce near-term volatility and execution challenges.
- Sees the current share price as close to fair value, with modest upside, and suggests investors closely monitor customer trends and industry dynamics.
Do you think there's more to the story for Harmonic? Head over to our Community to see what others are saying!
This article by Simply Wall St is general in nature. We provide commentary based on historical data and analyst forecasts only using an unbiased methodology and our articles are not intended to be financial advice. It does not constitute a recommendation to buy or sell any stock, and does not take account of your objectives, or your financial situation. We aim to bring you long-term focused analysis driven by fundamental data. Note that our analysis may not factor in the latest price-sensitive company announcements or qualitative material. Simply Wall St has no position in any stocks mentioned.
Have feedback on this article? Concerned about the content? Get in touch with us directly. Alternatively, email editorial-team@simplywallst.com