
- LIVE QUOTES
- LEARN
- HELP
 Nasdaq
 Wall Street Journal
EN
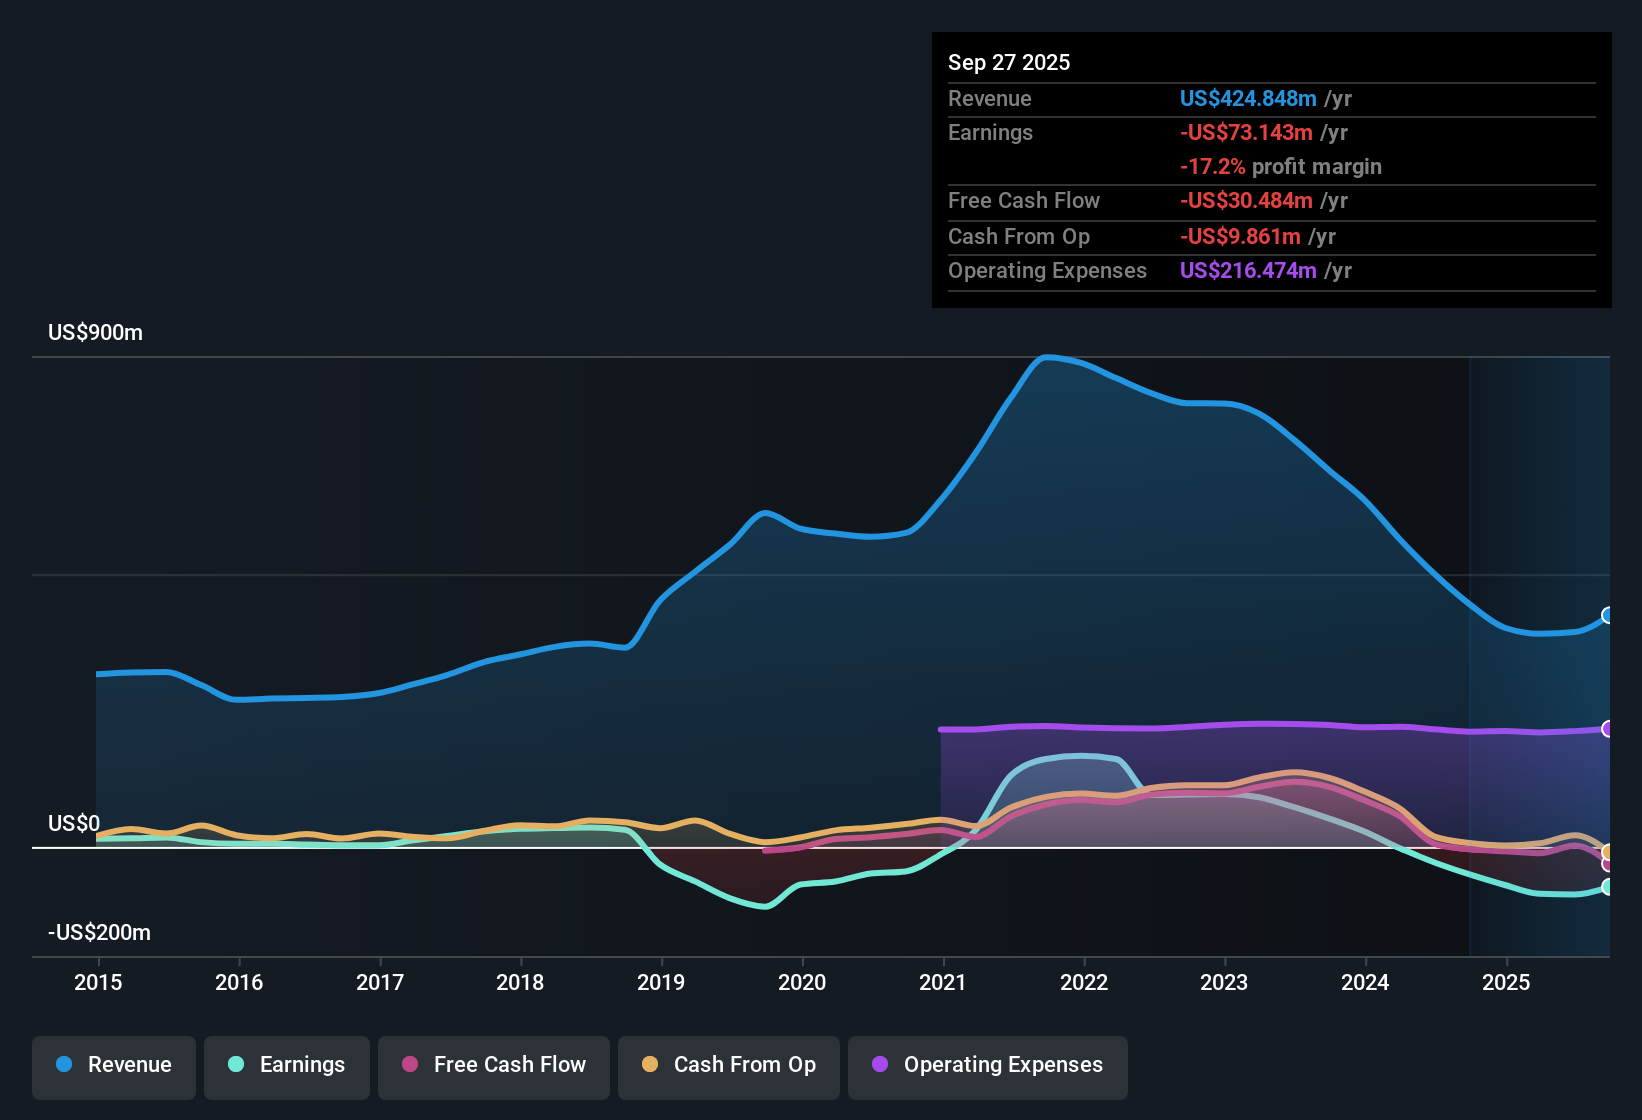
Cohu (COHU): Losses Worsen 43.2% Annually, Testing Value Narrative Despite Industry-Low Price-to-Sales
Cohu (COHU) continues to face headwinds, with the company remaining unprofitable and losses worsening by 43.2% per year over the past five years. Forecasts show revenue could grow 14.1% annually, outpacing the US market’s expected 10.3% growth rate, but net profit margins have yet to show improvement. Despite a favorable price-to-sales ratio of 2.6x compared to industry peers, investors must confront the reality of ongoing losses and a current share price of $24.06, well above the estimated fair value of $3.74.
See our full analysis for Cohu.Next up, we’ll see how these results compare with the dominant narratives shaping expectations, where reality meets the stories in the market.
See what the community is saying about Cohu
Analyst Targets Imply 25% Upside
- The current share price of $24.06 is 25.2% below the analyst consensus target of $25.75, suggesting some room for appreciation if projected recovery materializes.
- Analysts' consensus view remains constructive on upside, even as near-term margins are depressed.
- Consensus models expect revenues to reach $640.1 million and profit margins to swing from -22.1% to 14.1% in three years. This shift would lift earnings out of red territory if industry trends and cost savings play out as forecast.
- The consensus expects Cohu will need to reach a PE ratio of 17.6x (on anticipated $1.96 EPS) by 2028 for that target to hold. This is a valuation well below the current US semiconductor industry average of 30.1x.
- To dig deeper into how analysts and the market are weighing Cohu's turnaround, check what’s driving the consensus narrative.📊 Read the full Cohu Consensus Narrative.
Margins Still Deep in the Red
- Cohu’s net profit margin remains sharply negative at -22.1%, confirming ongoing unprofitability despite expected revenue growth.
- Analysts' consensus view says margin pressure is holding back a full recovery, but it is expected to moderate.
- New product wins and efficiency measures are forecast to lift net margins toward the industry average over three years. However, the company remains far from break-even today.
- Forecasts assume a steady climb, but management notes “seasonal slowdowns” and customer concentration could keep margins volatile in the near term.
Price-to-Sales Ratio Underpins Value Case
- Cohu’s price-to-sales ratio of 2.6x stands out against both the US semiconductor industry average of 5.3x and peer group’s 4.5x, highlighting notable relative value even with profitability still lagging peers.
- Analysts' consensus view highlights how the valuation gap may offer downside support.
- Compared to the DCF fair value of $3.74 per share, the current price appears rich on a discounted cash flow basis. However, versus sales multiples, Cohu is attractively priced relative to industry averages.
- This valuation mix challenges the simple bear thesis that the share price is too high, as relative value on price-to-sales may cushion downside while investors wait for margin improvement.
Next Steps
To see how these results tie into long-term growth, risks, and valuation, check out the full range of community narratives for Cohu on Simply Wall St. Add the company to your watchlist or portfolio so you'll be alerted when the story evolves.
Have a fresh take on the figures? Bring your perspective to life and shape your own story in just minutes: Do it your way
A great starting point for your Cohu research is our analysis highlighting 2 key rewards and 1 important warning sign that could impact your investment decision.
See What Else Is Out There
Cohu's persistent losses and still-negative profit margins illustrate the risk of waiting for a turnaround when stable results matter most.
If you want more certainty in your investments, our stable growth stocks screener (2112 results) spotlights companies that consistently deliver solid, reliable growth without the same profit swings.
This article by Simply Wall St is general in nature. We provide commentary based on historical data and analyst forecasts only using an unbiased methodology and our articles are not intended to be financial advice. It does not constitute a recommendation to buy or sell any stock, and does not take account of your objectives, or your financial situation. We aim to bring you long-term focused analysis driven by fundamental data. Note that our analysis may not factor in the latest price-sensitive company announcements or qualitative material. Simply Wall St has no position in any stocks mentioned.
Have feedback on this article? Concerned about the content? Get in touch with us directly. Alternatively, email editorial-team@simplywallst.com