
- LIVE QUOTES
- LEARN
- HELP
 Nasdaq
 Wall Street Journal
EN
Is fuboTV’s Stock a Bargain After Doubling in the Last Year?
Thinking about whether to buy, sell, or hold fuboTV? You're definitely not alone. After all, with a stock that has skyrocketed 153.9% year-to-date and doubled over the past twelve months, it's no wonder so many investors are taking a closer look. Yet, if you zoom out a bit, you’ll spot a rollercoaster. fuboTV’s shares are still down 2.2% over three years and a staggering 74.1% over the last five years. Recent weeks have been rocky as well, with the stock down 1.9% in just the past week and falling 14.8% over the last month.
Behind these moves, investors have kept a close eye on fuboTV's ongoing strategic pivots and its expanding content partnerships, which hint at new growth channels. These developments have helped fuel optimism about the company's longer-term narrative, even while short-term swings have tested nerves. The volatility is not just market noise. It reflects shifting perspectives about fuboTV’s risks and prospects.
Of course, numbers matter, and if you’re a fundamental investor at heart, you’ll want to know how the company stacks up on valuation. According to our latest analysis, fuboTV scores a 4 out of 6 on our valuation checklist. In other words, it’s considered undervalued in four major areas. In the next section, we’ll break down exactly how we arrived at this score using a range of classic valuation approaches. But stay tuned. At the end, we’ll share an even more insightful take on how to value a company like fuboTV in today’s evolving media landscape.
Approach 1: fuboTV Discounted Cash Flow (DCF) Analysis
The Discounted Cash Flow (DCF) model estimates a company's value by projecting its future free cash flows and discounting them back to their present value. This approach aims to capture the actual earning power of the business over time, independent of market sentiment.
For fuboTV, the current free cash flow stands at $128.9 Million, and analyst estimates are available through 2027, with projections extrapolated further based on industry trends. In 2027, free cash flow is expected to reach $117.2 Million. Over the next decade, Simply Wall St has modeled a range of growth rates, with projected free cash flows reaching approximately $98 Million by 2035. All figures are in US dollars, and these projections reflect a blend of analyst input and trend-based estimates.
Using the 2 Stage Free Cash Flow to Equity method, fuboTV’s estimated intrinsic value comes to $4.12 per share. At current market prices, this implies the stock is trading at a 13.1% discount to its fair value, suggesting the stock is undervalued based on its future cash generation potential.
Result: UNDERVALUED
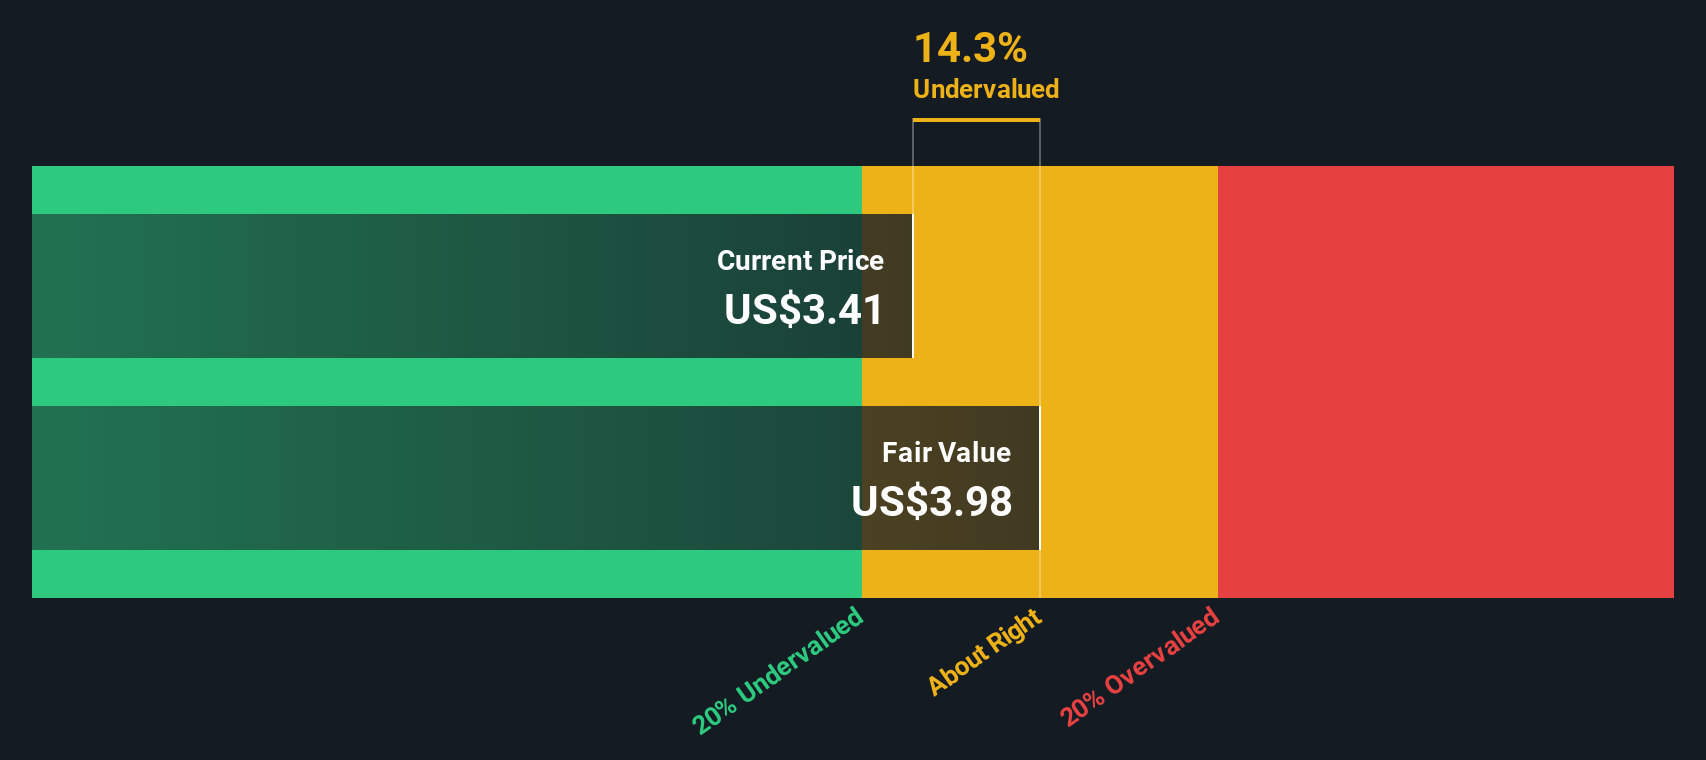
Our Discounted Cash Flow (DCF) analysis suggests fuboTV is undervalued by 13.1%. Track this in your watchlist or portfolio, or discover more undervalued stocks.
Approach 2: fuboTV Price vs Earnings
The Price-to-Earnings (PE) ratio is the preferred metric for valuing profitable companies like fuboTV because it directly reflects how much investors are willing to pay for each dollar of a company’s net income. This ratio is especially relevant for businesses with positive earnings, since it helps compare companies of various sizes on an even playing field.
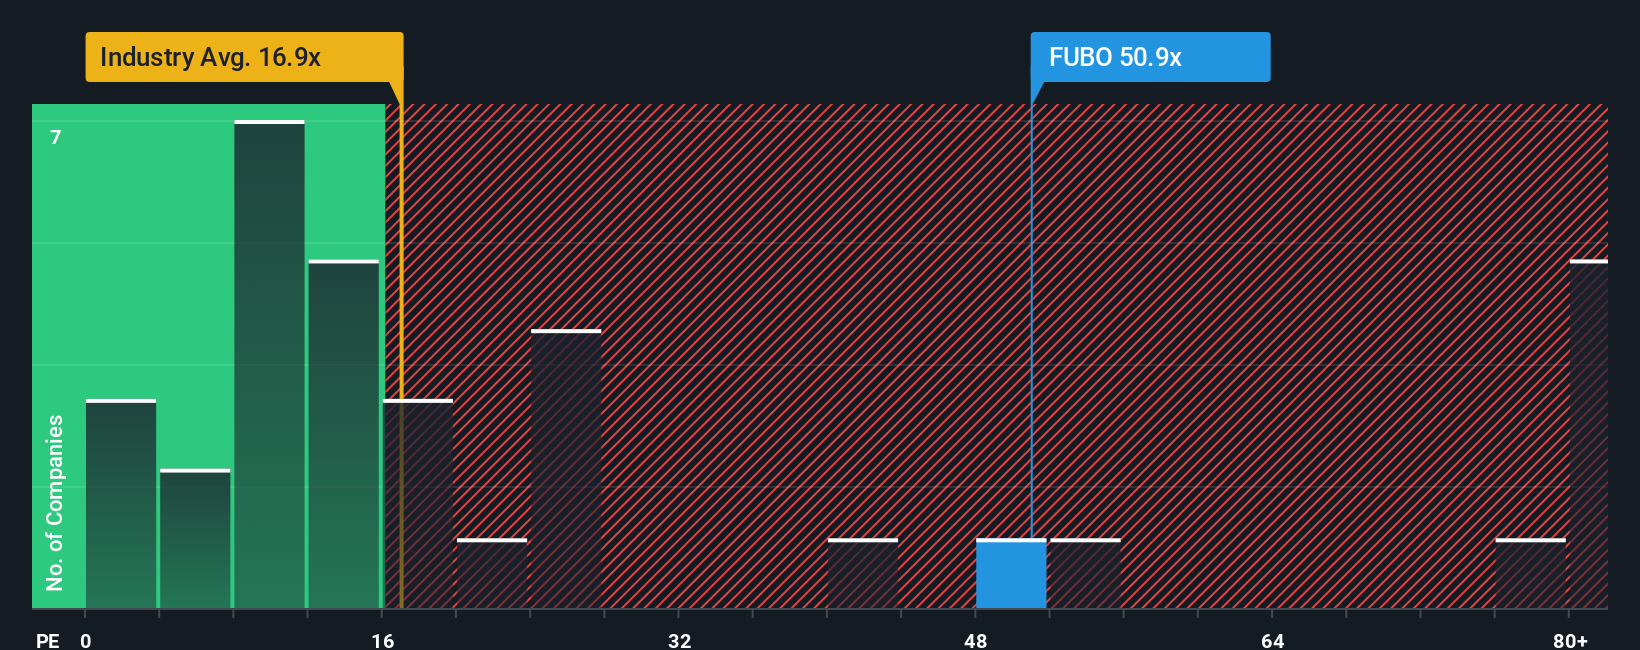
What makes a "fair" PE ratio? The answer typically hinges on a company’s growth outlook and risk profile. Fast-growing businesses tend to command higher PE multiples, while higher-risk companies or those with less consistent growth usually trade at lower PEs. Industry context is also key. For fuboTV, the current PE ratio stands at 14.0x, slightly below the Interactive Media and Services industry average of 15.6x and well beneath the peer average of 91.2x. This suggests the stock is not aggressively priced relative to these benchmarks.
Rather than relying solely on raw market averages, Simply Wall St’s “Fair Ratio” provides a more tailored perspective. This proprietary PE calculation is set at 6.0x for fuboTV and reflects the company’s specific earnings growth, risk factors, profit margins, business model, as well as its industry and market cap. Because it incorporates these individualized factors, the Fair Ratio gives a sharper and more actionable viewpoint than broad industry or peer group comparisons. Comparing fuboTV’s actual PE of 14.0x to its Fair Ratio of 6.0x points to the stock trading above what would be considered justified by its fundamentals.
Result: OVERVALUED
PE ratios tell one story, but what if the real opportunity lies elsewhere? Discover companies where insiders are betting big on explosive growth.
Upgrade Your Decision Making: Choose your fuboTV Narrative
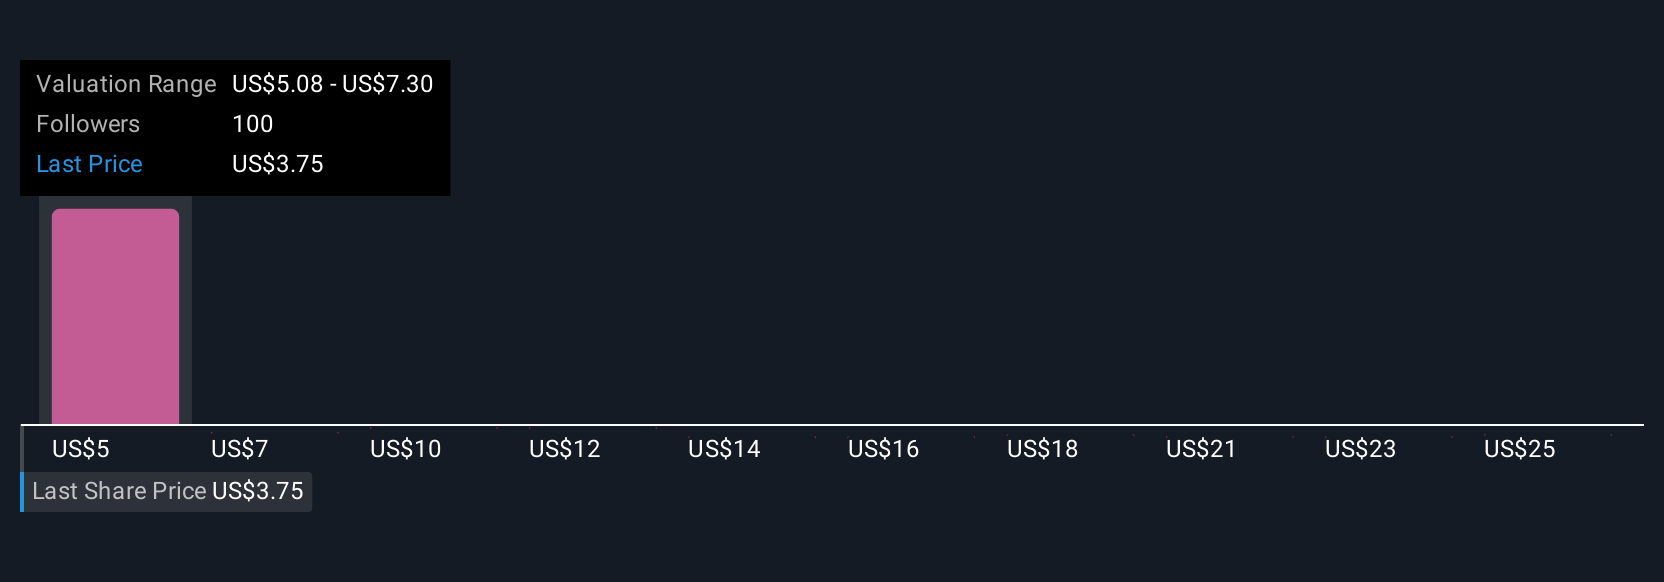
Earlier we mentioned that there’s an even better way to understand valuation, so let’s introduce you to Narratives. Narratives are an intuitive tool that let you define your own story for a company like fuboTV, combining your view of its future prospects, growth rates, and profit margins into one dynamic financial forecast. This approach directly links a company’s story to its estimated financial outcomes, empowering you to translate your expectations into fair value estimates and see how those stack up against the stock’s market price. Narratives are easily accessible on Simply Wall St’s Community page, trusted by millions of investors, and are automatically updated when fresh news or earnings are released, meaning your viewpoint can stay current with the company’s evolving story. For example, one fuboTV Narrative might project aggressive subscriber growth and improving margins, yielding a bullish fair value above $5 per share. A more cautious investor could focus on competitive risks and content challenges, resulting in a fair value closer to $4.25. By exploring different Narratives, you can visualize exactly where your outlook sits relative to the broader market and make smarter buy, sell, or hold decisions with up-to-the-minute confidence.
Do you think there's more to the story for fuboTV? Create your own Narrative to let the Community know!
This article by Simply Wall St is general in nature. We provide commentary based on historical data and analyst forecasts only using an unbiased methodology and our articles are not intended to be financial advice. It does not constitute a recommendation to buy or sell any stock, and does not take account of your objectives, or your financial situation. We aim to bring you long-term focused analysis driven by fundamental data. Note that our analysis may not factor in the latest price-sensitive company announcements or qualitative material. Simply Wall St has no position in any stocks mentioned.
Have feedback on this article? Concerned about the content? Get in touch with us directly. Alternatively, email editorial-team@simplywallst.com