
- LIVE QUOTES
- LEARN
- HELP
 Nasdaq
 Wall Street Journal
EN
Is Omnicom a Bargain After Recent PR Deal and Three-Year 25% Stock Gain?
Wondering what to do with Omnicom Group stock? You are not alone. After all, making sense of this media and marketing giant’s price swings is no easy feat. The numbers tell a story: shares most recently closed at $78.55, with a dip of 1.5% over the past week, but up 1.7% for the past month. Year to date, Omnicom is down 9.1%. That might worry some investors, but if you zoom out, there is a longer-term growth streak, with gains of 25.1% over three years and an impressive 83.0% over five. It is clear that sentiment around risk and prospects can shift rapidly in this sector, especially as the advertising market responds to both digital disruption and changing client budgets.
So what is really going on beneath the surface for Omnicom? This is where it gets interesting. On a straight valuation basis, Omnicom Group scores a near-perfect 6 out of 6 across the main undervaluation checks. This suggests that, by those measures, the stock looks distinctly undervalued. In this article, we will break down exactly what those valuation methods are and how Omnicom stacks up. But better yet, stick around, because before we finish, you will get a smarter, more holistic take on company valuation than just the numbers alone.
Why Omnicom Group is lagging behind its peers
Approach 1: Omnicom Group Discounted Cash Flow (DCF) Analysis
The Discounted Cash Flow (DCF) model estimates the true value of a company by projecting its future cash flows and discounting them back to today's dollars. This helps investors assess what the business is really worth, stripping away market noise.
For Omnicom Group, the numbers provide a robust story. The company generated $1.80 billion in Free Cash Flow (FCF) over the last twelve months. Analyst forecasts, which extend reliably over the next five years, see FCF rising steadily. By 2027, FCF is projected to reach $1.97 billion. Beyond these analyst estimates, Simply Wall St extrapolates that Free Cash Flow could top $2.61 billion by 2035. All cash flow figures are quoted in US dollars.
All these future cash flows are discounted to reflect the time value of money. The end result is that the intrinsic, or fair, value of Omnicom's shares is calculated at $231.32. Compared to the recent market price of $78.55, this implies that Omnicom Group is trading at a 66.0% discount to its fair value, which is an unusually wide gap for a company of its size and consistency.
Result: UNDERVALUED
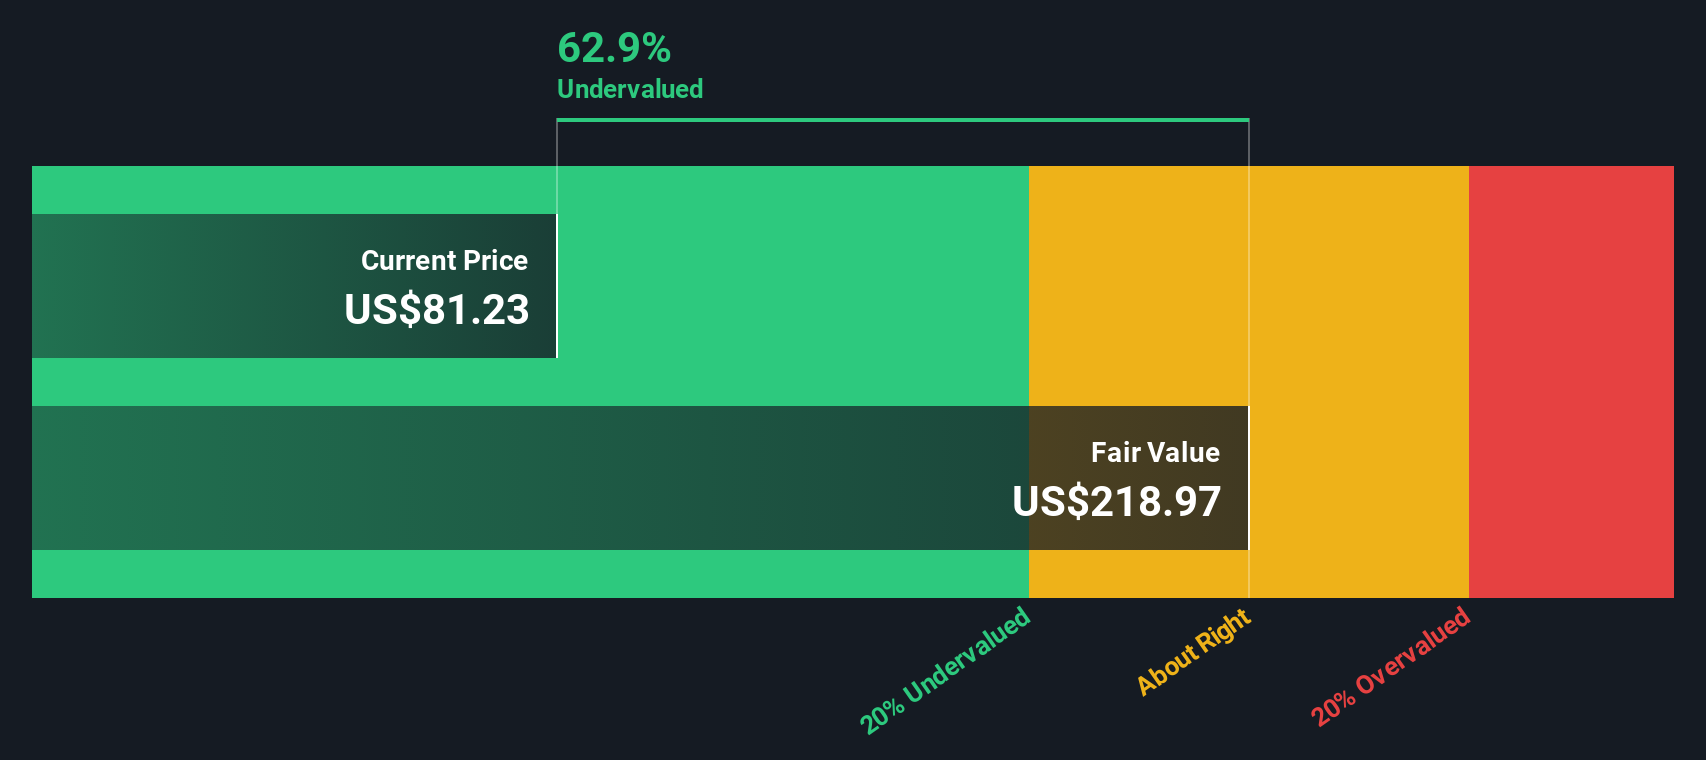
Our Discounted Cash Flow (DCF) analysis suggests Omnicom Group is undervalued by 66.0%. Track this in your watchlist or portfolio, or discover more undervalued stocks.
Approach 2: Omnicom Group Price vs Earnings
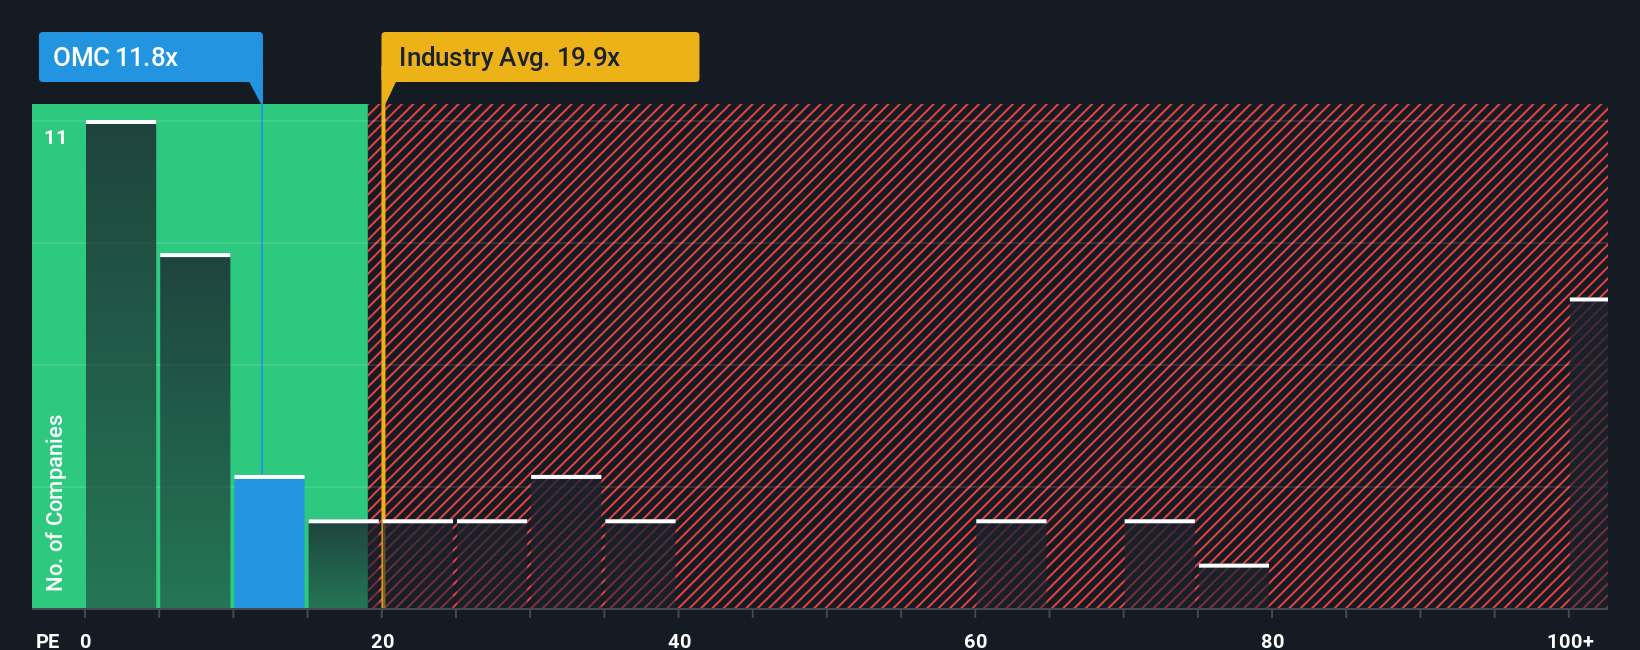
The Price-to-Earnings (PE) ratio is one of the most widely used metrics for valuing profitable companies, especially those with established earnings streams like Omnicom Group. By comparing a company's current share price to its per-share earnings, the PE ratio gives investors a sense of how much they are paying for each dollar of profit.
However, what counts as a "normal" or "fair" PE ratio depends on more than just earnings. Companies expected to grow faster, or those facing less risk, tend to trade at higher PE multiples. Slower-growing or riskier companies usually have lower ratios. Therefore, to judge whether Omnicom's valuation is attractive, we need to benchmark it carefully.
Currently, Omnicom Group trades at a PE ratio of 11.0x. That is significantly lower than the broader Media industry average of 19.6x and much less than the peer group average of 42.9x. At face value, this could signal that Omnicom is undervalued compared to its sector and competitors.
There is a more comprehensive way to analyze valuation. Simply Wall St's proprietary "Fair Ratio" goes beyond basic industry or peer averages by accounting for Omnicom's specific earnings growth, profit margins, market capitalization, and risk profile. In Omnicom's case, the Fair Ratio is calculated to be 20.8x. This suggests that, given its unique fundamentals, a significantly higher multiple could arguably be justified.
When comparing Omnicom’s actual PE multiple of 11.0x to its Fair Ratio of 20.8x, it appears materially undervalued based on the key factors that should matter most to investors, rather than relying solely on simplistic peer comparisons.
Result: UNDERVALUED
PE ratios tell one story, but what if the real opportunity lies elsewhere? Discover companies where insiders are betting big on explosive growth.
Upgrade Your Decision Making: Choose your Omnicom Group Narrative
Earlier we mentioned that there is an even better way to understand valuation, so let us introduce you to Narratives. A Narrative is simply your chance to tell the story behind a company’s numbers, tying together your perspective about Omnicom Group’s business outlook with your assumptions for revenue, profit margins, and future estimates, ultimately arriving at your own fair value for the stock.
With Narratives, the company’s story meets hard numbers: you can map out how your view on Omnicom’s growth prospects, risks, and industry changes translates into expected financial results, then see exactly how this shapes your estimate of what the stock is worth. Narratives are designed to be easy and accessible to everyone; they are available right now on Simply Wall St’s Community page, used by millions worldwide to share perspectives, compare forecasts, and sharpen their investment decisions.
Narratives empower you to compare your calculated Fair Value to today’s market price at a glance and make confident investment decisions. In addition, they update automatically whenever important news or earnings are released, so your investment thesis always stays relevant.
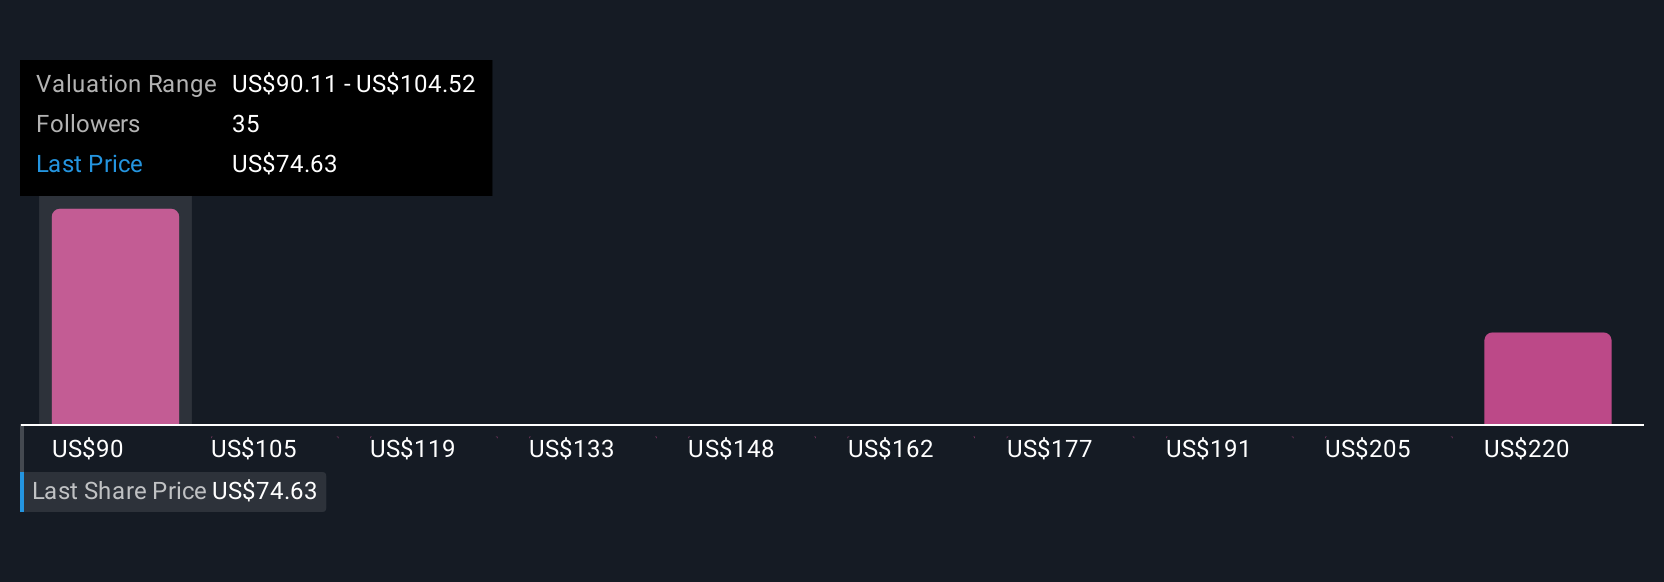
For Omnicom Group, for example, the most bullish Narrative values the stock at $115 based on anticipated AI-driven revenue synergies, while the most bearish sees only $78 due to margin pressure and integration risks. This allows you to pick the story that fits your outlook.
Do you think there's more to the story for Omnicom Group? Create your own Narrative to let the Community know!
This article by Simply Wall St is general in nature. We provide commentary based on historical data and analyst forecasts only using an unbiased methodology and our articles are not intended to be financial advice. It does not constitute a recommendation to buy or sell any stock, and does not take account of your objectives, or your financial situation. We aim to bring you long-term focused analysis driven by fundamental data. Note that our analysis may not factor in the latest price-sensitive company announcements or qualitative material. Simply Wall St has no position in any stocks mentioned.
Have feedback on this article? Concerned about the content? Get in touch with us directly. Alternatively, email editorial-team@simplywallst.com