
- LIVE QUOTES
- LEARN
- HELP
 Nasdaq
 Wall Street Journal
EN
Is Weatherford Stock Attractive in 2025 After Recent 9% Rally and Energy Market Moves?
If you are eyeing Weatherford International stock and weighing your next move, you are in good company. After all, this is a stock that knows how to keep investors guessing, with sharp moves and a long-term story that turns heads. In just the past week, Weatherford rallied by 9.2%, nearly matching its 9.3% climb over the past month. Yet, if you zoom out, the journey gets more interesting: the stock has skyrocketed by 119.7% in three years and a stunning 3,714.5% over five years, even while its one-year return is down 16.9%. That kind of performance highlights not only the rollercoaster ride of the oilfield services sector but also how quickly risk perceptions can shift, especially as global energy markets evolve and investor sentiment swings with broader industry trends.
It is also worth noting that Weatherford scores a five out of six on a well-known valuation checklist, signaling the company is undervalued on most counts that matter. The implication here is clear: while the price action reflects both nerves and optimism, fundamentals might be telling a quieter, more promising story. Next, we will break down how traditional valuation approaches stack up for Weatherford. And if you are looking for a fresh perspective beyond the usual scorecards, stick around. There is one more angle we think every investor should see before making any decisions.
Why Weatherford International is lagging behind its peersApproach 1: Weatherford International Discounted Cash Flow (DCF) Analysis
A Discounted Cash Flow (DCF) model estimates a company's intrinsic value by projecting its future cash flows and then discounting them back to today's dollars. The idea is to figure out what all those future cash flows would be worth if you had them right now, giving a measure of what the business itself is truly worth.
For Weatherford International, the latest reported Free Cash Flow stands at $537.6 million. Analysts provide growth projections for the next few years, with estimates showing Free Cash Flow rising to $767.7 million by 2028. After that, forecasts become more speculative but are extrapolated further, with the ten-year projection reaching over $1 billion in annual Free Cash Flow.
Applying this two-stage DCF approach, Simply Wall St calculates an intrinsic value of $208.87 per share. Importantly, this valuation suggests that Weatherford stock is currently trading at a steep discount, roughly 66.7% below its estimated fair value. In other words, the DCF model views the stock as significantly undervalued based on the expected stream of future cash flows.
Result: UNDERVALUED
Head to the Valuation section of our Company Report for more details on how we arrive at this Fair Value for Weatherford International.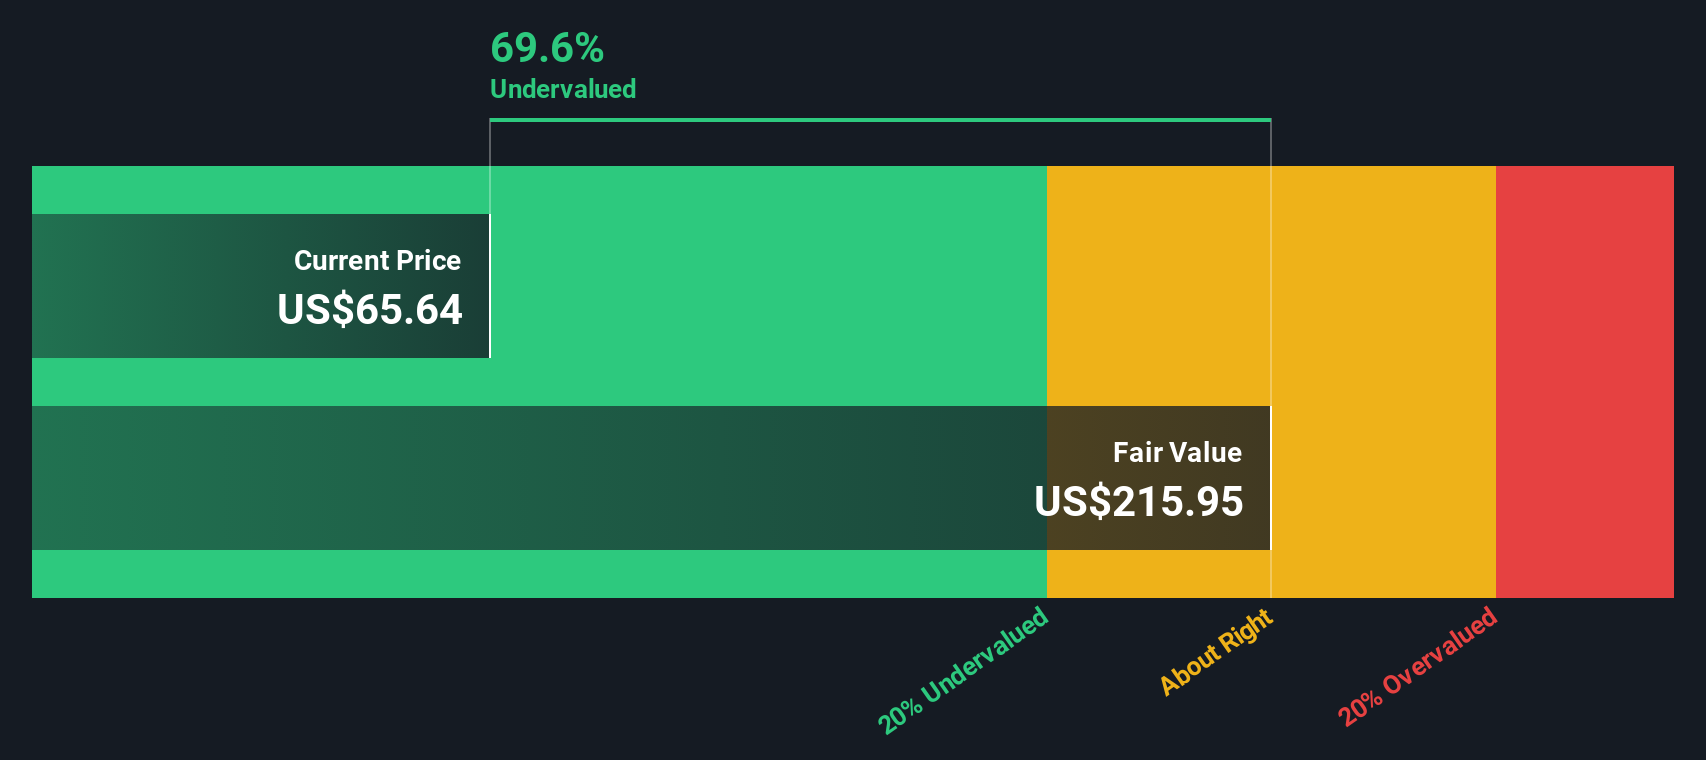
Approach 2: Weatherford International Price vs Earnings
For companies consistently generating profits, the Price-to-Earnings (PE) ratio is one of the best ways to gauge valuation. It tells investors how much they are paying for each dollar of earnings, making it especially useful for companies like Weatherford International that have positive earnings.
However, what counts as a “normal” or “fair” PE ratio is not one-size-fits-all. Factors like the company's future earnings growth, perceived risks, and market conditions all play a role. Higher growth and lower risk usually justify a higher PE, while uncertainty tends to drag the multiple down.
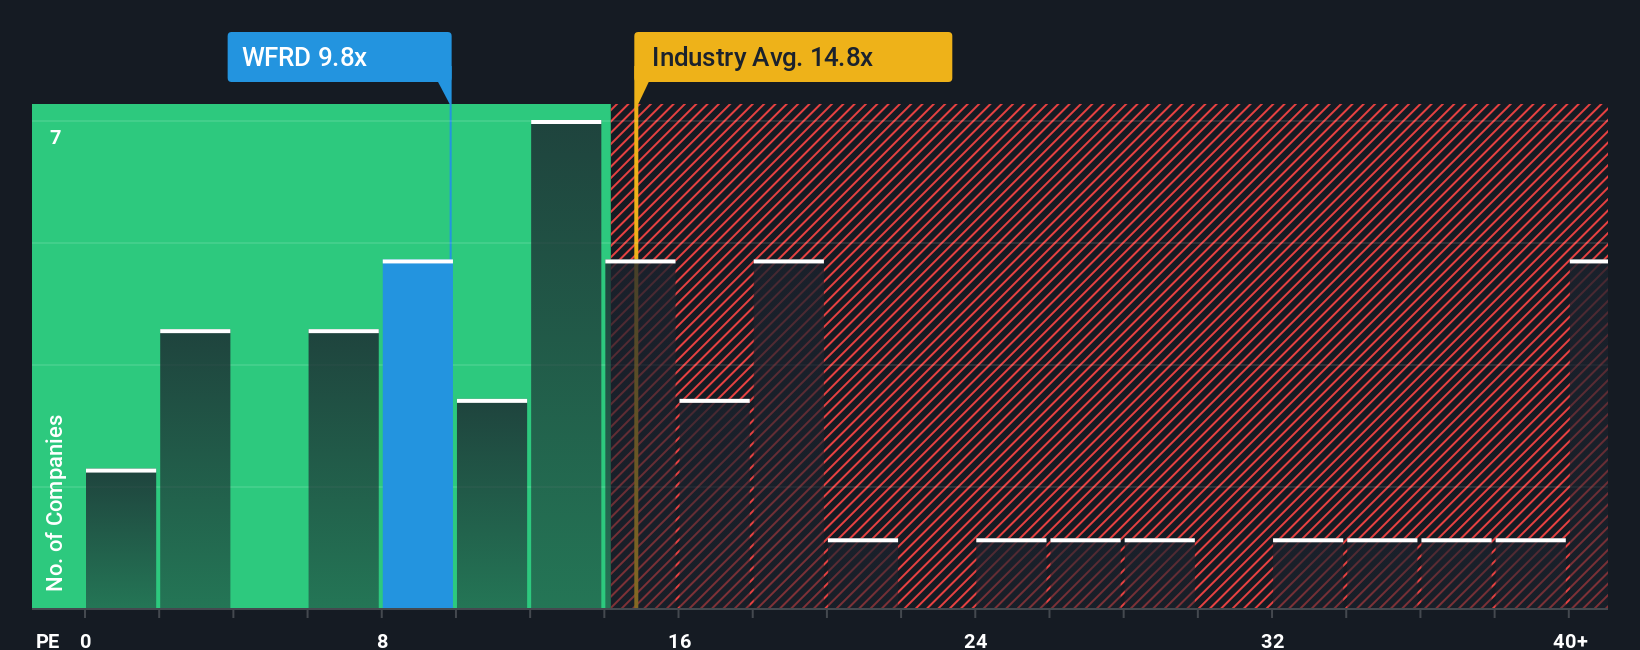
Weatherford currently trades at a PE ratio of 10.4x. That is noticeably below both the Energy Services industry average of 15.25x and the broader peer group’s average of 21.12x. While this gap might suggest undervaluation, it does not paint the whole picture.
This is where Simply Wall St's Fair Ratio comes in. It offers a tailored benchmark based on several company-specific factors such as profit margin, growth outlook, market cap, and risks, not just broad sector averages. For Weatherford, the Fair Ratio sits at 13.44x, higher than the current PE. This suggests that the stock is trading below what would be expected for a company with its characteristics.
Result: UNDERVALUED
Upgrade Your Decision Making: Choose your Weatherford International Narrative
Earlier we mentioned there is a better way to understand valuation, so let us introduce you to Narratives. A Narrative is essentially your investment story for a company. It is the thinking that connects your view of how Weatherford International’s business will perform with your forecasts for its future revenue, earnings, margins, and ultimately, the fair value you assign to the stock. Narratives empower you to bridge the gap between numbers and nuanced perspectives, making it easy to see not just what the numbers say but why you believe they matter.
Available directly on Simply Wall St’s Community page, Narratives are a simple but powerful tool adopted by millions of investors. They help you make smarter buy or sell decisions by letting you compare your Fair Value for Weatherford to its current Price, all based on your own assumptions, and they update instantly as new developments, news, or earnings releases come in. This ensures your thesis is always in sync with reality.
For example, some investors may build a bullish Narrative for Weatherford, forecasting advanced technology adoption and leaner operations to drive a fair value as high as $74.00 per share. Others might focus on risks like global market softness and margin pressure, resulting in a more cautious fair value of $58.00. Narratives allow these differences to shine through, showing how your outlook shapes your valuation and giving you a clearer, more personal framework for each investment choice.
Do you think there's more to the story for Weatherford International? Create your own Narrative to let the Community know!
This article by Simply Wall St is general in nature. We provide commentary based on historical data and analyst forecasts only using an unbiased methodology and our articles are not intended to be financial advice. It does not constitute a recommendation to buy or sell any stock, and does not take account of your objectives, or your financial situation. We aim to bring you long-term focused analysis driven by fundamental data. Note that our analysis may not factor in the latest price-sensitive company announcements or qualitative material. Simply Wall St has no position in any stocks mentioned.
Have feedback on this article? Concerned about the content? Get in touch with us directly. Alternatively, email editorial-team@simplywallst.com