
- LIVE QUOTES
- LEARN
- HELP
 Nasdaq
 Wall Street Journal
EN
Genworth Financial (GNW): Assessing Valuation Following New Share Buyback Authorization
Price-to-Earnings of 17.7x: Is it justified?
Genworth Financial currently trades at a price-to-earnings (P/E) ratio of 17.7 times, which is noticeably higher than the average multiples of both its peers and the broader US insurance industry. This suggests the stock may be overvalued on this traditional measure, especially relative to what the sector usually commands for similar earnings. This is the case despite recent momentum in results and share price.
The P/E ratio is a widely used metric for evaluating whether a company's share price accurately reflects its earnings potential. In the insurance sector, where consistent profits and risk management are key, a higher P/E can mean the market expects above-average growth, or that investors are simply paying a premium for perceived quality or momentum.
For Genworth, the current P/E sits well above the peer average of 10.1 times and slightly above the US insurance industry average of 13.8 times. This premium implies either unusually high expectations for future profit growth or that the market is overpricing the stock compared to its underlying fundamentals and sector norms.
Result: Fair Value of $7.11 (OVERVALUED)
See our latest analysis for Genworth Financial.However, unexpected shifts in interest rates or a slowdown in core business growth could quickly challenge the strong momentum Genworth Financial currently enjoys.
Find out about the key risks to this Genworth Financial narrative.Another View: SWS DCF Model Weighs In
While the price-to-earnings ratio suggests Genworth Financial’s shares are priced at a premium, our SWS DCF model also finds the stock to be overvalued. These are two different lenses with the same result, but are the assumptions behind each holding up?
Look into how the SWS DCF model arrives at its fair value.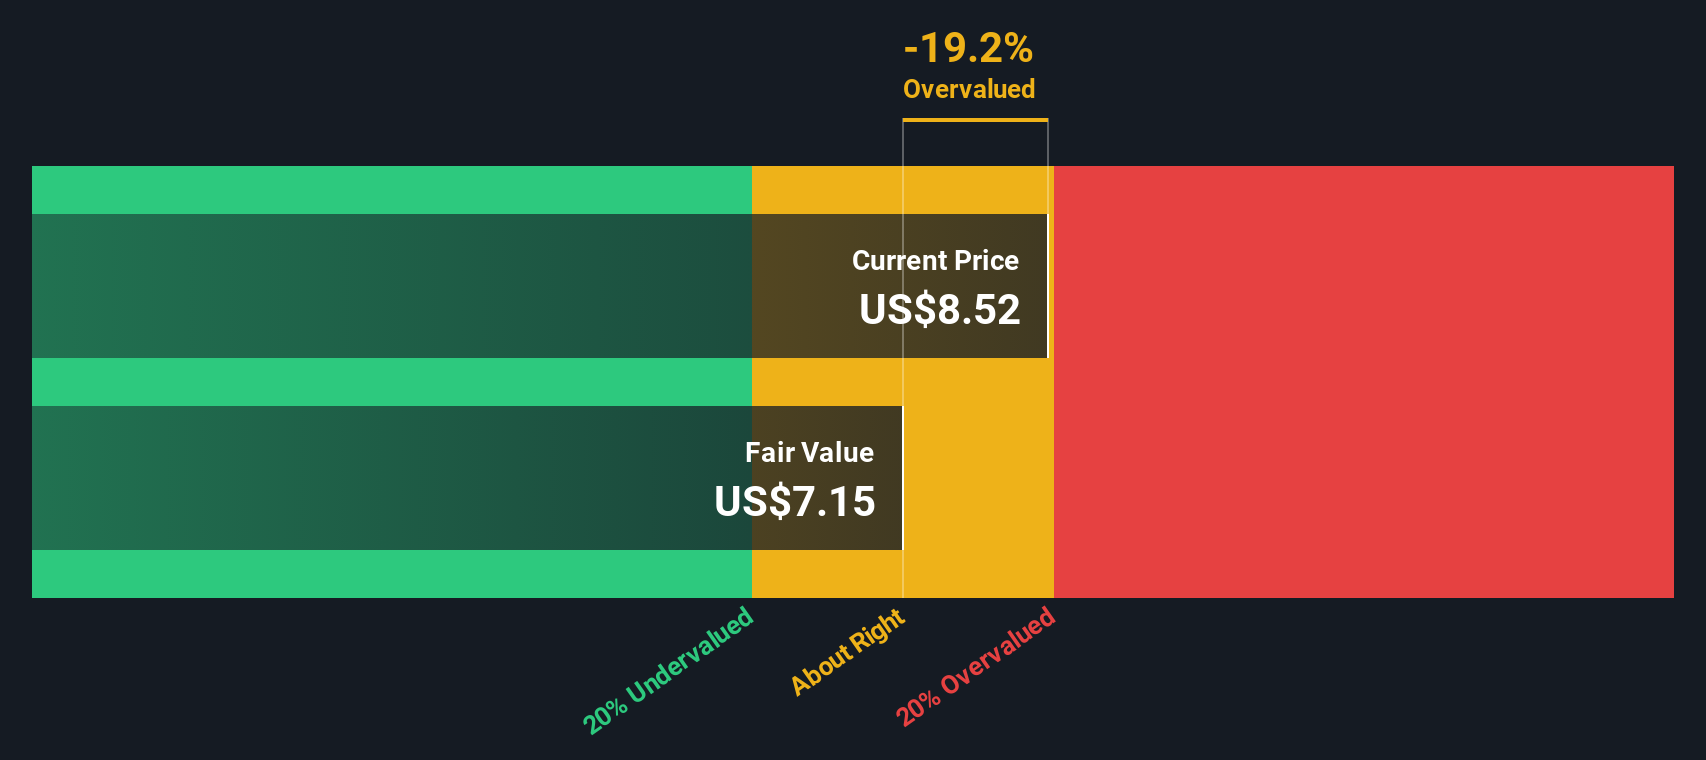
Build Your Own Genworth Financial Narrative
If you have a different take on Genworth Financial, or would prefer to analyze the data yourself, forming your own view is straightforward and only takes a few minutes: Do it your way.
A great starting point for your Genworth Financial research is our analysis highlighting 2 key rewards and 2 important warning signs that could impact your investment decision.
Looking for more investment ideas?
Smart investors always keep an eye on fresh opportunities. Don’t let potential wins pass you by. Put your strategy to work using powerful pre-screened investment ideas designed to match your goals, risk, and curiosity.
- Tap into powerful technology trends by checking out the hottest AI stocks shaking up industries: AI penny stocks.
- Take control of your income potential with handpicked companies offering attractive yields: dividend stocks with yields > 3%.
- Spot tomorrow’s breakout bargains by searching undervalued stocks ready to impress: undervalued stocks based on cash flows.
This article by Simply Wall St is general in nature. We provide commentary based on historical data and analyst forecasts only using an unbiased methodology and our articles are not intended to be financial advice. It does not constitute a recommendation to buy or sell any stock, and does not take account of your objectives, or your financial situation. We aim to bring you long-term focused analysis driven by fundamental data. Note that our analysis may not factor in the latest price-sensitive company announcements or qualitative material. Simply Wall St has no position in any stocks mentioned.
Have feedback on this article? Concerned about the content? Get in touch with us directly. Alternatively, email editorial-team@simplywallst.com