
- LIVE QUOTES
- LEARN
- HELP
 Nasdaq
 Wall Street Journal
EN
Is Lam Research’s Run Up After Nvidia Chip News Justified in 2025?
So you are thinking about Lam Research stock—a smart move. It is one of those names that has consistently drawn attention, whether you are a seasoned semiconductor enthusiast or just looking for the next growth story to add to your portfolio. Over the past year, Lam Research has been anything but quiet. The share price has climbed a massive 65.6% over the last twelve months, and that only tells part of the story. Just in the past thirty days, the stock has surged 26.8%, with 8.5% of that coming in the last week alone. Year-to-date, investors are sitting on a staggering 75.2% gain, and if you zoom out over five years, Lam has delivered a total return above 300%. That kind of run is hard to ignore.
Some recent market developments have helped shine the spotlight on the entire semiconductor equipment sector, with Lam Research right in the middle of the action. Increased demand for advanced chips, ongoing supply chain adjustments, and a push for greater chip production capacity globally have all played their roles in shaping market perception and investor appetite. With sentiment heating up, you might be wondering if Lam Research’s valuation is still justified, or if the price is running ahead of reality.
By the numbers, Lam Research's value score is just 2 out of 6, signaling that it's currently undervalued in only two key checks. While that suggests room for scrutiny, conventional valuation methods only tell part of the story. Let us dig into those approaches, and later, I will share a perspective that goes even deeper into what valuation can mean for a dynamic company like Lam Research.
Lam Research scores just 2/6 on our valuation checks. See what other red flags we found in the full valuation breakdown.Approach 1: Lam Research Discounted Cash Flow (DCF) Analysis
The Discounted Cash Flow (DCF) model estimates a company’s intrinsic value by forecasting future cash flows and discounting those projections back to today's value. It gives investors a sense of what the business is fundamentally worth, separate from any current market sentiment.
For Lam Research, the most recent reported Free Cash Flow stands at $5.57 billion. Analyst estimates extend for the next five years, after which projections are extrapolated by Simply Wall St to cover a full decade. By 2030, Lam Research’s annual Free Cash Flow is expected to reach $6.81 billion. Each future year’s projected cash flows are individually discounted to reflect their present-day worth, using a 2 Stage Free Cash Flow to Equity model.
After adding up all those discounted cash flows, the DCF model calculates an intrinsic value of $56.57 per share. That figure is dramatically below Lam Research’s current trading price, which signals the stock is trading at a premium. In fact, the implied discount from DCF is negative 124.3%, which points to a significant overvaluation relative to fundamentals.
Result: OVERVALUED
Head to the Valuation section of our Company Report for more details on how we arrive at this Fair Value for Lam Research.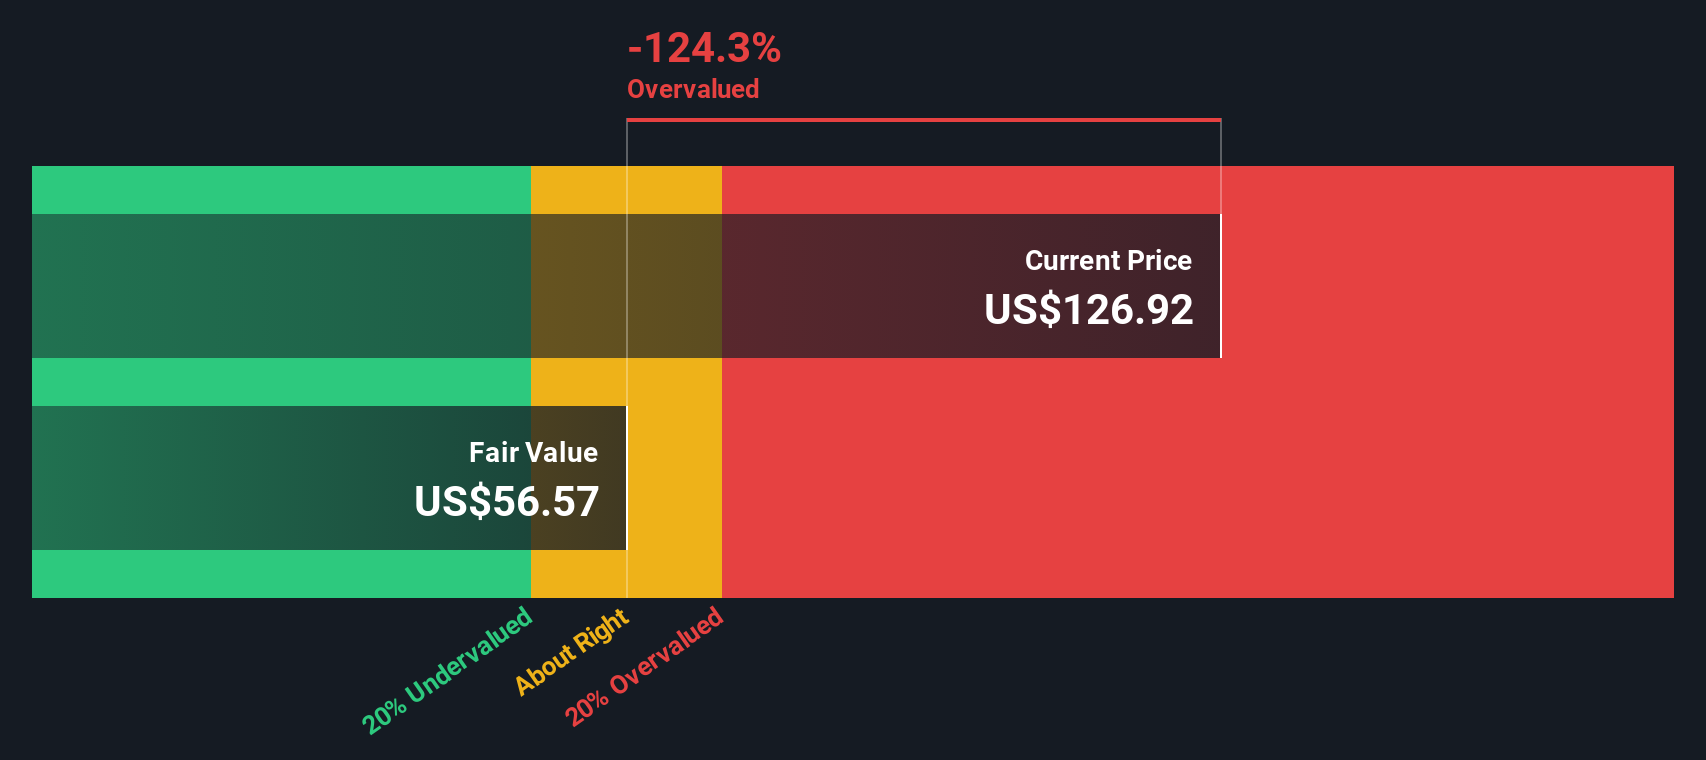
Approach 2: Lam Research Price vs Earnings
The price-to-earnings (PE) ratio is widely considered the go-to metric for valuing profitable companies like Lam Research, as it shows how much investors are paying for each dollar of current earnings. This makes it a quick way to gauge whether the stock price reflects realistic expectations about earnings power and future profitability.
A "normal" or fair PE ratio depends largely on a company’s expected earnings growth and risk profile. Firms with higher expected growth and lower risk typically command higher multiples, while those facing slower growth or greater uncertainty tend to trade at lower ratios.
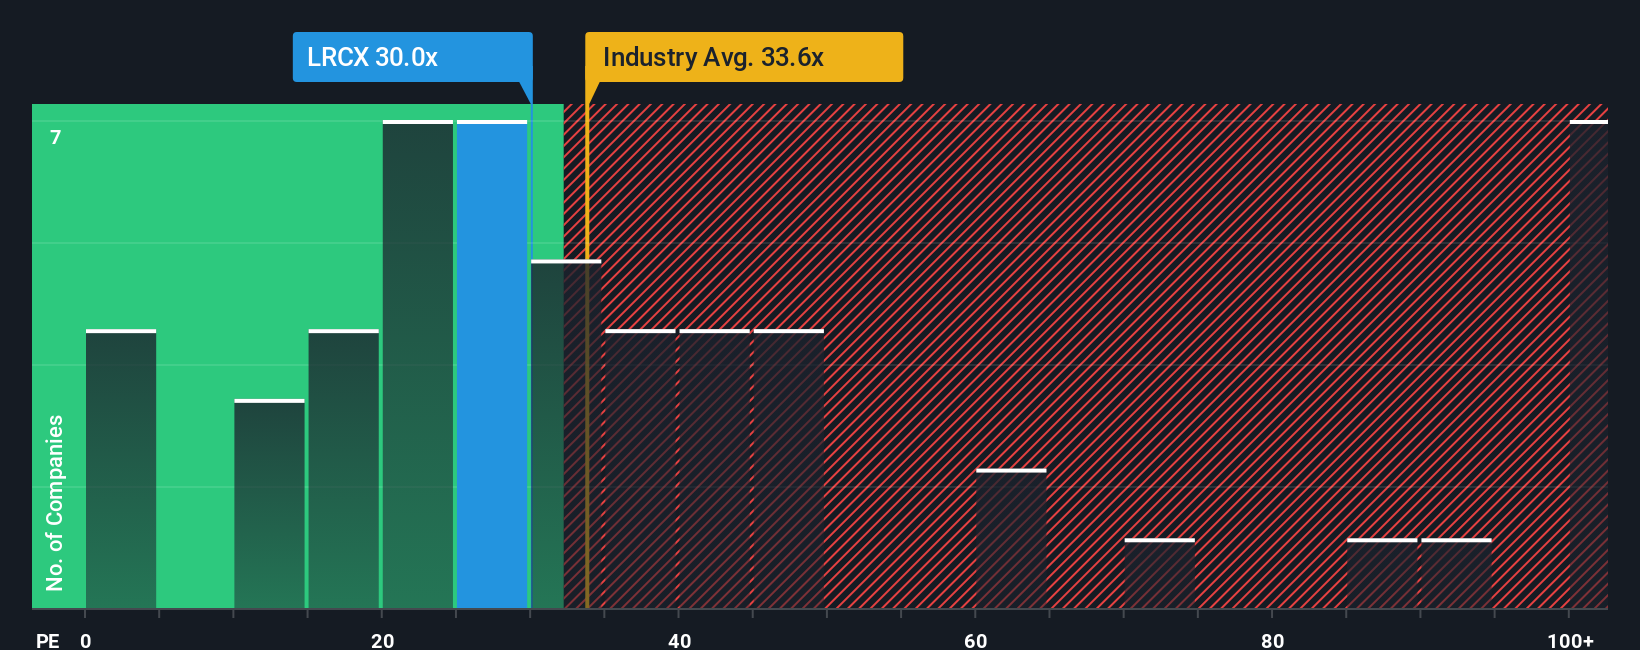
Currently, Lam Research trades at a PE ratio of 30x. When compared to the semiconductor industry average of 33.6x and a peer average of 36.2x, Lam appears modestly cheaper than its rivals and the broader sector.
However, Simply Wall St’s proprietary Fair Ratio, which considers factors like Lam’s specific growth outlook, margins, industry dynamics, market cap, and risk, suggests a benchmark of 28.3x for Lam Research. This tailored Fair Ratio is considered more reliable than generic peer or sector comparisons because it provides a nuanced view based on what makes Lam unique.
When comparing the Fair Ratio (28.3x) with Lam’s actual PE (30x), the difference is small and falls within a margin where the stock’s valuation can be considered reasonable for its profile.
Result: ABOUT RIGHT
Upgrade Your Decision Making: Choose your Lam Research Narrative
Earlier, we mentioned that there is an even better way to understand valuation. Let us introduce you to Narratives, a simple but powerful approach that helps you put your own story behind the numbers. In essence, a Narrative lets you spell out your viewpoint on a company using your assumptions about future revenue, earnings, and margins, and then ties those assumptions to a financial forecast and fair value. Narratives bridge the gap between what you believe will happen for Lam Research and what that means for its share price. This makes your investment decisions more transparent and actionable.
On Simply Wall St’s platform, Narratives are easy to create and refine through the Community page used by millions of investors. You can see in real time how differences in your beliefs, such as expecting bullish growth versus bracing for margin pressures, lead to different fair values. For Lam Research, for example, the most optimistic Narrative assumes robust demand from advanced chip manufacturing and sets a fair value at $135 per share. The most cautious view sees greater risks from competition and demand swings, implying just $80 per share. Narratives update dynamically as news or earnings come in, so your fair value stays relevant and helps you decide if now is the right time to buy or sell based on the latest information and your perspective.
Do you think there's more to the story for Lam Research? Create your own Narrative to let the Community know!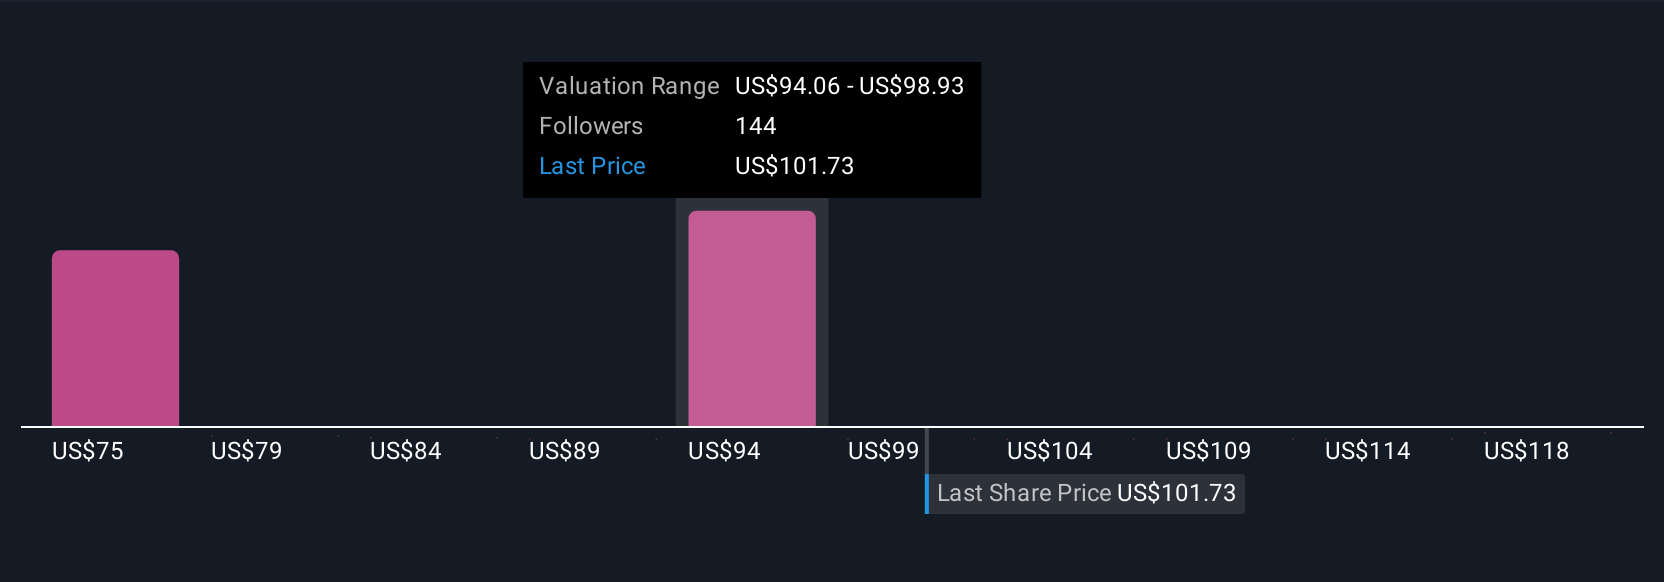
This article by Simply Wall St is general in nature. We provide commentary based on historical data and analyst forecasts only using an unbiased methodology and our articles are not intended to be financial advice. It does not constitute a recommendation to buy or sell any stock, and does not take account of your objectives, or your financial situation. We aim to bring you long-term focused analysis driven by fundamental data. Note that our analysis may not factor in the latest price-sensitive company announcements or qualitative material. Simply Wall St has no position in any stocks mentioned.
Have feedback on this article? Concerned about the content? Get in touch with us directly. Alternatively, email editorial-team@simplywallst.com