
- LIVE QUOTES
- LEARN
- HELP
 Nasdaq
 Wall Street Journal
EN
Is Friedman Industries, Incorporated's (NASDAQ:FRD) Recent Stock Performance Influenced By Its Fundamentals In Any Way?
Most readers would already be aware that Friedman Industries' (NASDAQ:FRD) stock increased significantly by 46% over the past month. As most would know, fundamentals are what usually guide market price movements over the long-term, so we decided to look at the company's key financial indicators today to determine if they have any role to play in the recent price movement. Particularly, we will be paying attention to Friedman Industries' ROE today.
ROE or return on equity is a useful tool to assess how effectively a company can generate returns on the investment it received from its shareholders. In simpler terms, it measures the profitability of a company in relation to shareholder's equity.
How Do You Calculate Return On Equity?
Return on equity can be calculated by using the formula:
Return on Equity = Net Profit (from continuing operations) ÷ Shareholders' Equity
So, based on the above formula, the ROE for Friedman Industries is:
6.2% = US$8.5m ÷ US$137m (Based on the trailing twelve months to June 2025).
The 'return' is the yearly profit. So, this means that for every $1 of its shareholder's investments, the company generates a profit of $0.06.
View our latest analysis for Friedman Industries
What Has ROE Got To Do With Earnings Growth?
So far, we've learned that ROE is a measure of a company's profitability. Based on how much of its profits the company chooses to reinvest or "retain", we are then able to evaluate a company's future ability to generate profits. Generally speaking, other things being equal, firms with a high return on equity and profit retention, have a higher growth rate than firms that don’t share these attributes.
A Side By Side comparison of Friedman Industries' Earnings Growth And 6.2% ROE
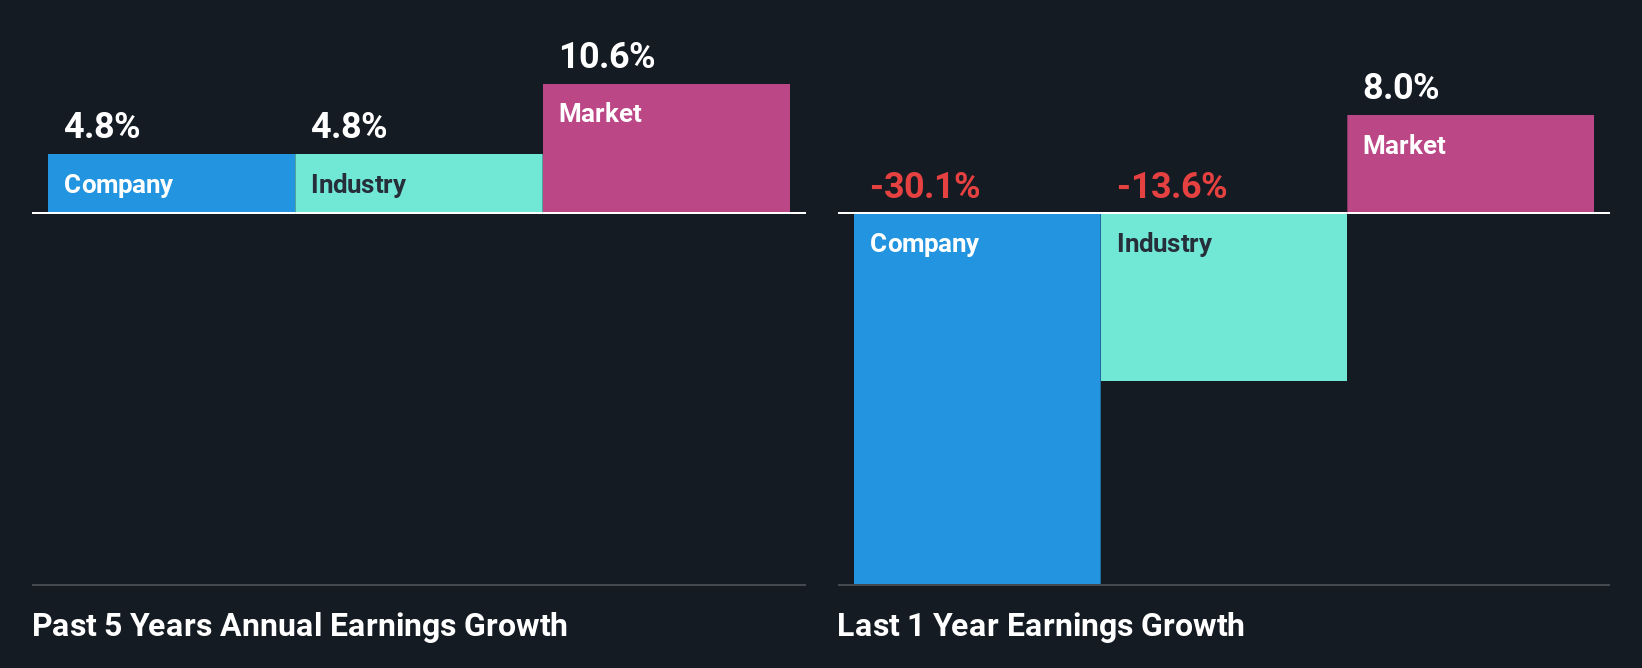
At first glance, Friedman Industries' ROE doesn't look very promising. We then compared the company's ROE to the broader industry and were disappointed to see that the ROE is lower than the industry average of 12%. Accordingly, Friedman Industries' low net income growth of 4.8% over the past five years can possibly be explained by the low ROE amongst other factors.
Next, on comparing Friedman Industries' net income growth with the industry, we found that the company's reported growth is similar to the industry average growth rate of 4.8% over the last few years.
Earnings growth is a huge factor in stock valuation. The investor should try to establish if the expected growth or decline in earnings, whichever the case may be, is priced in. This then helps them determine if the stock is placed for a bright or bleak future. If you're wondering about Friedman Industries''s valuation, check out this gauge of its price-to-earnings ratio, as compared to its industry.
Is Friedman Industries Making Efficient Use Of Its Profits?
Friedman Industries' low three-year median payout ratio of 7.0% (or a retention ratio of 93%) should mean that the company is retaining most of its earnings to fuel its growth. This should be reflected in its earnings growth number, but that's not the case. Therefore, there might be some other reasons to explain the lack in that respect. For example, the business could be in decline.
Additionally, Friedman Industries has paid dividends over a period of at least ten years, which means that the company's management is determined to pay dividends even if it means little to no earnings growth.
Summary
On the whole, we do feel that Friedman Industries has some positive attributes. That is, a decent growth in earnings backed by a high rate of reinvestment. However, we do feel that that earnings growth could have been higher if the business were to improve on the low ROE rate. Especially given how the company is reinvesting a huge chunk of its profits.
Have feedback on this article? Concerned about the content? Get in touch with us directly. Alternatively, email editorial-team (at) simplywallst.com.
This article by Simply Wall St is general in nature. We provide commentary based on historical data and analyst forecasts only using an unbiased methodology and our articles are not intended to be financial advice. It does not constitute a recommendation to buy or sell any stock, and does not take account of your objectives, or your financial situation. We aim to bring you long-term focused analysis driven by fundamental data. Note that our analysis may not factor in the latest price-sensitive company announcements or qualitative material. Simply Wall St has no position in any stocks mentioned.