
- LIVE QUOTES
- LEARN
- HELP
 Nasdaq
 Wall Street Journal
EN
CSW Industrials (NYSE:CSW) Could Easily Take On More Debt
Legendary fund manager Li Lu (who Charlie Munger backed) once said, 'The biggest investment risk is not the volatility of prices, but whether you will suffer a permanent loss of capital.' It's only natural to consider a company's balance sheet when you examine how risky it is, since debt is often involved when a business collapses. We can see that CSW Industrials, Inc. (NYSE:CSW) does use debt in its business. But the real question is whether this debt is making the company risky.
What Risk Does Debt Bring?
Debt is a tool to help businesses grow, but if a business is incapable of paying off its lenders, then it exists at their mercy. Part and parcel of capitalism is the process of 'creative destruction' where failed businesses are mercilessly liquidated by their bankers. However, a more common (but still painful) scenario is that it has to raise new equity capital at a low price, thus permanently diluting shareholders. By replacing dilution, though, debt can be an extremely good tool for businesses that need capital to invest in growth at high rates of return. When we think about a company's use of debt, we first look at cash and debt together.
What Is CSW Industrials's Net Debt?
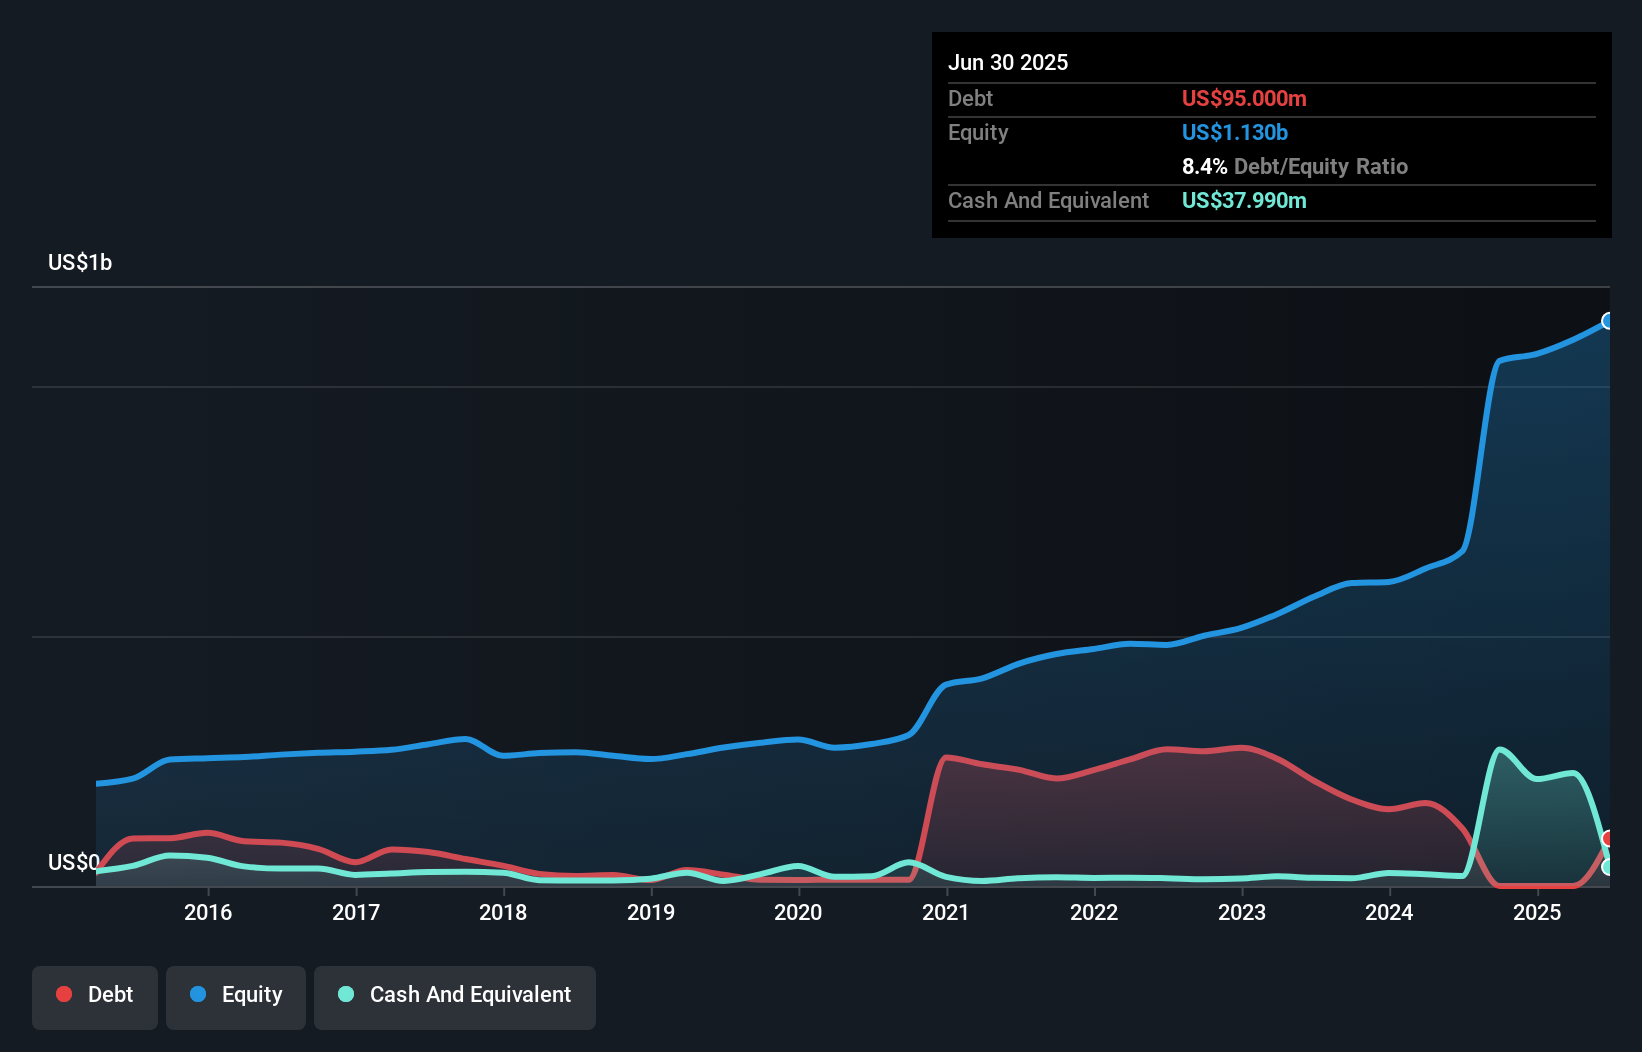
You can click the graphic below for the historical numbers, but it shows that CSW Industrials had US$95.0m of debt in June 2025, down from US$115.0m, one year before. However, because it has a cash reserve of US$38.0m, its net debt is less, at about US$57.0m.
How Strong Is CSW Industrials' Balance Sheet?
The latest balance sheet data shows that CSW Industrials had liabilities of US$157.9m due within a year, and liabilities of US$247.8m falling due after that. Offsetting this, it had US$38.0m in cash and US$179.4m in receivables that were due within 12 months. So its liabilities outweigh the sum of its cash and (near-term) receivables by US$188.3m.
Since publicly traded CSW Industrials shares are worth a total of US$4.48b, it seems unlikely that this level of liabilities would be a major threat. But there are sufficient liabilities that we would certainly recommend shareholders continue to monitor the balance sheet, going forward. But either way, CSW Industrials has virtually no net debt, so it's fair to say it does not have a heavy debt load!
View our latest analysis for CSW Industrials
We use two main ratios to inform us about debt levels relative to earnings. The first is net debt divided by earnings before interest, tax, depreciation, and amortization (EBITDA), while the second is how many times its earnings before interest and tax (EBIT) covers its interest expense (or its interest cover, for short). Thus we consider debt relative to earnings both with and without depreciation and amortization expenses.
CSW Industrials has a low debt to EBITDA ratio of only 0.25. And remarkably, despite having net debt, it actually received more in interest over the last twelve months than it had to pay. So it's fair to say it can handle debt like a hotshot teppanyaki chef handles cooking. Fortunately, CSW Industrials grew its EBIT by 7.8% in the last year, making that debt load look even more manageable. The balance sheet is clearly the area to focus on when you are analysing debt. But ultimately the future profitability of the business will decide if CSW Industrials can strengthen its balance sheet over time. So if you want to see what the professionals think, you might find this free report on analyst profit forecasts to be interesting.
Finally, a business needs free cash flow to pay off debt; accounting profits just don't cut it. So we clearly need to look at whether that EBIT is leading to corresponding free cash flow. During the last three years, CSW Industrials generated free cash flow amounting to a very robust 90% of its EBIT, more than we'd expect. That puts it in a very strong position to pay down debt.
Our View
The good news is that CSW Industrials's demonstrated ability to cover its interest expense with its EBIT delights us like a fluffy puppy does a toddler. And the good news does not stop there, as its conversion of EBIT to free cash flow also supports that impression! Considering this range of factors, it seems to us that CSW Industrials is quite prudent with its debt, and the risks seem well managed. So we're not worried about the use of a little leverage on the balance sheet. Above most other metrics, we think its important to track how fast earnings per share is growing, if at all. If you've also come to that realization, you're in luck, because today you can view this interactive graph of CSW Industrials's earnings per share history for free.
If, after all that, you're more interested in a fast growing company with a rock-solid balance sheet, then check out our list of net cash growth stocks without delay.
Have feedback on this article? Concerned about the content? Get in touch with us directly. Alternatively, email editorial-team (at) simplywallst.com.
This article by Simply Wall St is general in nature. We provide commentary based on historical data and analyst forecasts only using an unbiased methodology and our articles are not intended to be financial advice. It does not constitute a recommendation to buy or sell any stock, and does not take account of your objectives, or your financial situation. We aim to bring you long-term focused analysis driven by fundamental data. Note that our analysis may not factor in the latest price-sensitive company announcements or qualitative material. Simply Wall St has no position in any stocks mentioned.