
- PRICING
- LIVE QUOTES
- LEARN
- HELP


EN
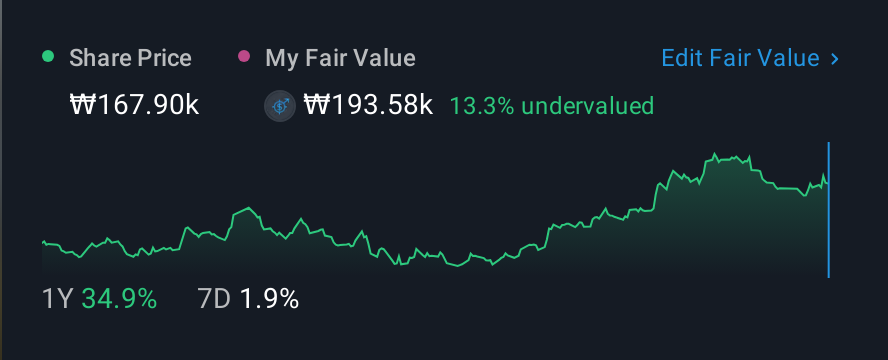
Hyundai Glovis Co., Ltd.'s (KRX:086280) high institutional ownership speaks for itself as stock continues to impress, up 14% over last week
Key Insights
- Institutions' substantial holdings in Hyundai Glovis implies that they have significant influence over the company's share price
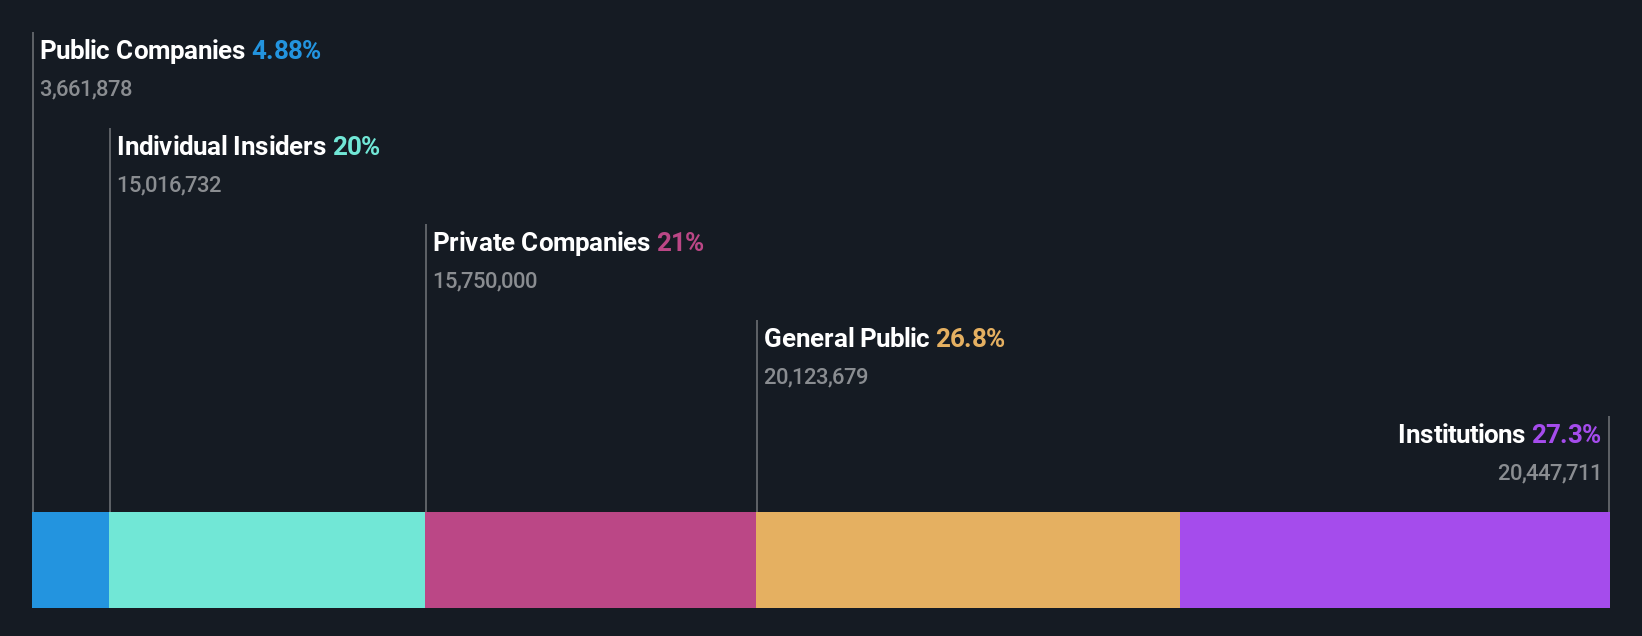
- The top 4 shareholders own 51% of the company
- Insider ownership in Hyundai Glovis is 20%
A look at the shareholders of Hyundai Glovis Co., Ltd. (KRX:086280) can tell us which group is most powerful. We can see that institutions own the lion's share in the company with 27% ownership. That is, the group stands to benefit the most if the stock rises (or lose the most if there is a downturn).
Last week’s 14% gain means that institutional investors were on the positive end of the spectrum even as the company has shown strong longer-term trends. The one-year return on investment is currently 63% and last week's gain would have been more than welcomed.
In the chart below, we zoom in on the different ownership groups of Hyundai Glovis.
See our latest analysis for Hyundai Glovis
What Does The Institutional Ownership Tell Us About Hyundai Glovis?
Institutional investors commonly compare their own returns to the returns of a commonly followed index. So they generally do consider buying larger companies that are included in the relevant benchmark index.
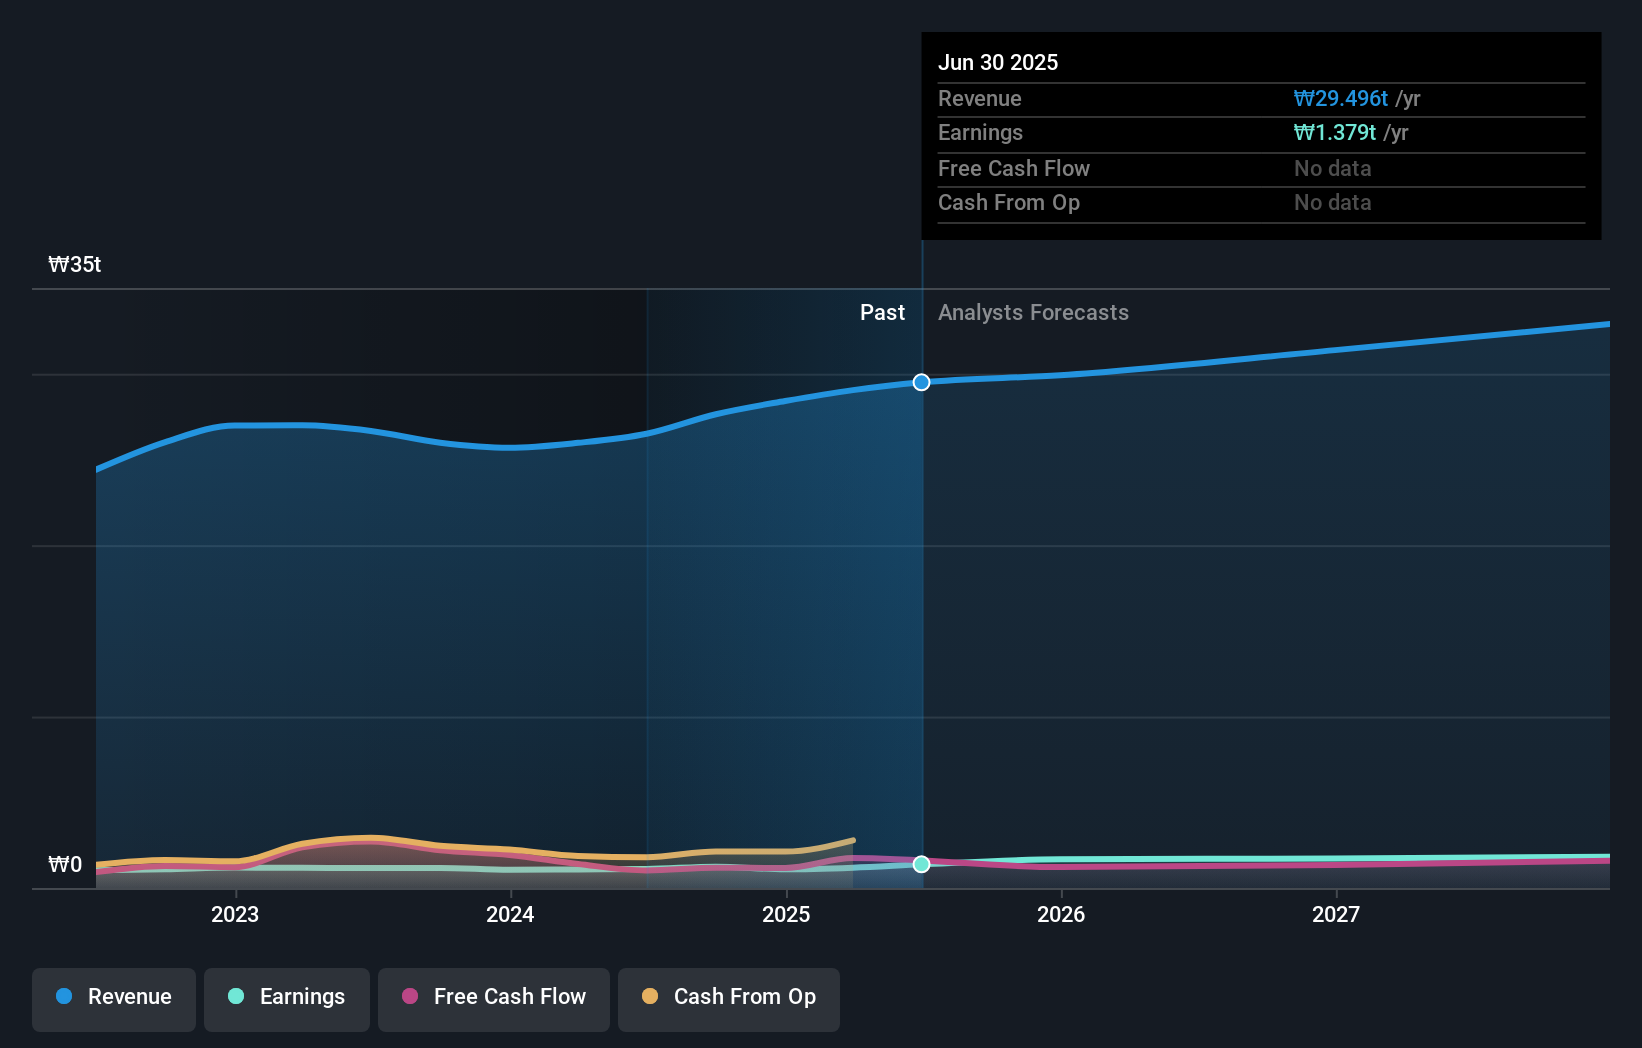
Hyundai Glovis already has institutions on the share registry. Indeed, they own a respectable stake in the company. This implies the analysts working for those institutions have looked at the stock and they like it. But just like anyone else, they could be wrong. When multiple institutions own a stock, there's always a risk that they are in a 'crowded trade'. When such a trade goes wrong, multiple parties may compete to sell stock fast. This risk is higher in a company without a history of growth. You can see Hyundai Glovis' historic earnings and revenue below, but keep in mind there's always more to the story.
Hedge funds don't have many shares in Hyundai Glovis. Our data shows that Eui-Sun Chung is the largest shareholder with 20% of shares outstanding. Meanwhile, the second and third largest shareholders, hold 11% and 10%, of the shares outstanding, respectively.
On looking further, we found that 51% of the shares are owned by the top 4 shareholders. In other words, these shareholders have a meaningful say in the decisions of the company.
Researching institutional ownership is a good way to gauge and filter a stock's expected performance. The same can be achieved by studying analyst sentiments. Quite a few analysts cover the stock, so you could look into forecast growth quite easily.
Insider Ownership Of Hyundai Glovis
While the precise definition of an insider can be subjective, almost everyone considers board members to be insiders. Management ultimately answers to the board. However, it is not uncommon for managers to be executive board members, especially if they are a founder or the CEO.
I generally consider insider ownership to be a good thing. However, on some occasions it makes it more difficult for other shareholders to hold the board accountable for decisions.
It seems insiders own a significant proportion of Hyundai Glovis Co., Ltd.. It has a market capitalization of just ₩13t, and insiders have ₩2.5t worth of shares in their own names. That's quite significant. It is good to see this level of investment. You can check here to see if those insiders have been buying recently.
General Public Ownership
The general public, who are usually individual investors, hold a 27% stake in Hyundai Glovis. While this group can't necessarily call the shots, it can certainly have a real influence on how the company is run.
Private Company Ownership
It seems that Private Companies own 21%, of the Hyundai Glovis stock. Private companies may be related parties. Sometimes insiders have an interest in a public company through a holding in a private company, rather than in their own capacity as an individual. While it's hard to draw any broad stroke conclusions, it is worth noting as an area for further research.
Public Company Ownership
Public companies currently own 4.9% of Hyundai Glovis stock. We can't be certain but it is quite possible this is a strategic stake. The businesses may be similar, or work together.
Next Steps:
While it is well worth considering the different groups that own a company, there are other factors that are even more important.
I always like to check for a history of revenue growth. You can too, by accessing this free chart of historic revenue and earnings in this detailed graph.
If you are like me, you may want to think about whether this company will grow or shrink. Luckily, you can check this free report showing analyst forecasts for its future.
NB: Figures in this article are calculated using data from the last twelve months, which refer to the 12-month period ending on the last date of the month the financial statement is dated. This may not be consistent with full year annual report figures.
Have feedback on this article? Concerned about the content? Get in touch with us directly. Alternatively, email editorial-team (at) simplywallst.com.
This article by Simply Wall St is general in nature. We provide commentary based on historical data and analyst forecasts only using an unbiased methodology and our articles are not intended to be financial advice. It does not constitute a recommendation to buy or sell any stock, and does not take account of your objectives, or your financial situation. We aim to bring you long-term focused analysis driven by fundamental data. Note that our analysis may not factor in the latest price-sensitive company announcements or qualitative material. Simply Wall St has no position in any stocks mentioned.