
- PRICING
- LIVE QUOTES
- LEARN
- HELP


EN
The 5 Best Indicators Every Trader and Investor Should Know
Whether you’re day trading, swing trading, or building a long-term portfolio, the right indicators can make the difference between guessing and making confident, data-driven decisions. Indicators help you identify trends, spot reversals, confirm entries, and manage risk — but with so many to choose from, which ones actually matter?
We’ve put together a Beginner’s Guide to the Top 5 Indicators that every trader and investor should have in their toolkit. In this video, we break down each one, show you how they work, and explain how you can start using them right away.
#1. Price Action & Volume: The Market’s Truth Serum
Even with all the indicators in the world, price action and volume tell the real story. We’ll explain how to read candlestick patterns and volume surges to confirm your trades.
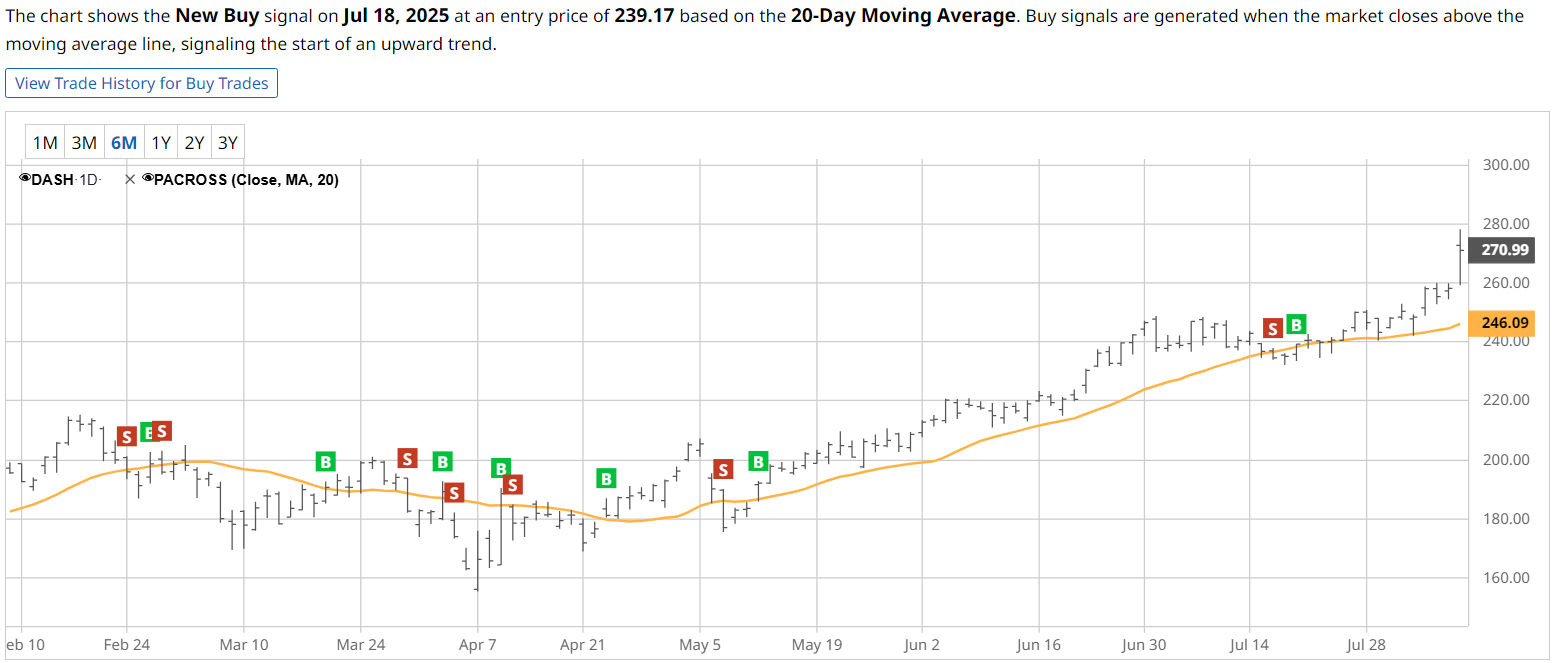
#2. Moving Averages: The Foundation of Trend Analysis
Moving averages, like the 50-day or 200-day, help you smooth out market noise and see the bigger picture. They’re perfect for spotting the start of a trend or warning you when momentum is fading. Learn how to use them to define bullish and bearish conditions — and avoid false signals.
#3. RSI: The Overbought/Oversold Gauge
The Relative Strength Index is a simple yet powerful tool for identifying when a stock may be stretched too far in either direction. We’ll show you how traders use RSI levels to time entries and exits.
#4. MACD: Spotting Momentum Shifts
The Moving Average Convergence Divergence indicator is one of the best ways to spot potential reversals before they happen. In the video, we break down MACD crossovers and histogram changes so you can anticipate momentum swings.
#5. TTM Squeeze: Catching Big Moves Before They Happen
This volatility-based indicator can signal when a stock is coiling up for a breakout. You’ll learn how to identify squeezes and use them to get in early on high-probability setups.
Why This Matters Right Now
With markets moving quickly and earnings season in full swing, these tools can help you separate real opportunities from market noise.
Watch the full breakdown here:
If you want to make smarter trades and investments, start by mastering these 5 indicators. Watch the video, save your favorite setups, and put them to work in your trading strategy today.
On the date of publication, Barchart Insights did not have (either directly or indirectly) positions in any of the securities mentioned in this article. All information and data in this article is solely for informational purposes. For more information please view the Barchart Disclosure Policy here.