
- PRICING
- LIVE QUOTES
- LEARN
- HELP


EN
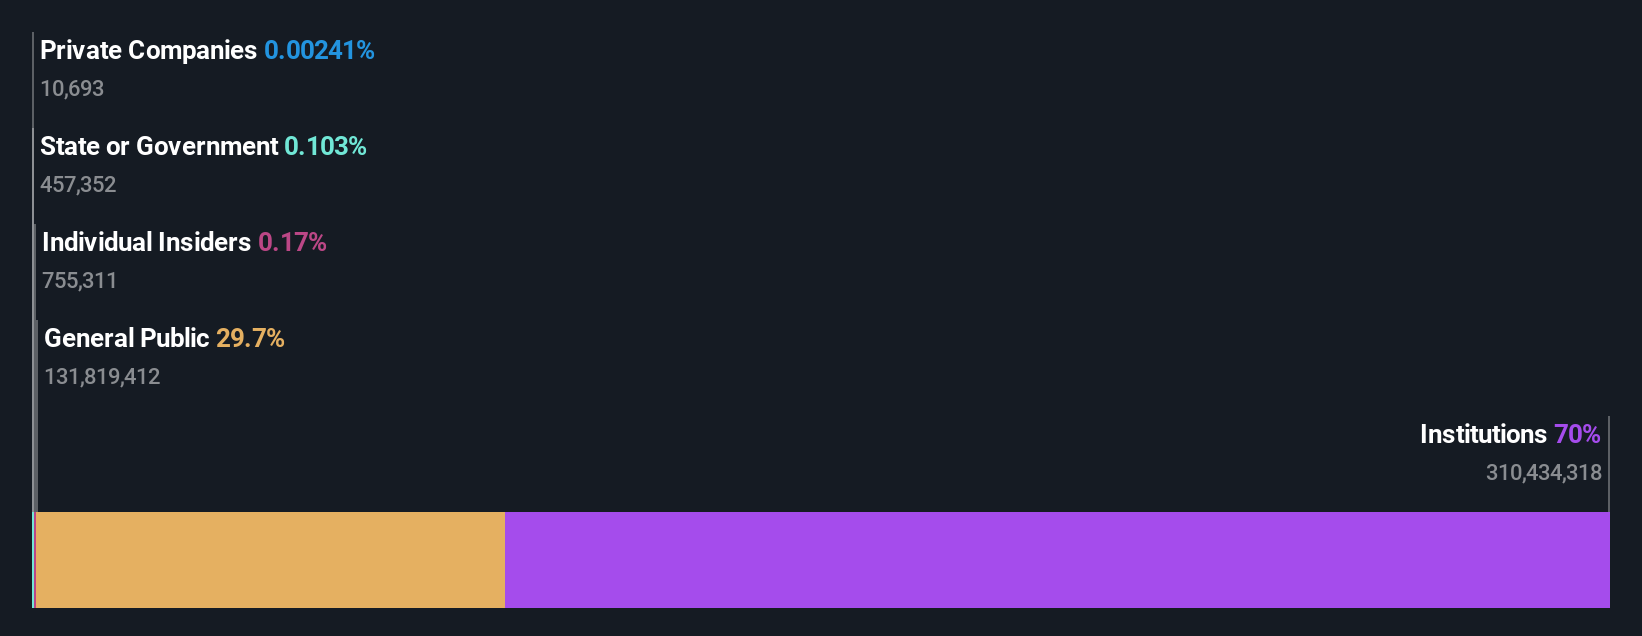
With 70% ownership of the shares, Costco Wholesale Corporation (NASDAQ:COST) is heavily dominated by institutional owners
Key Insights
- Given the large stake in the stock by institutions, Costco Wholesale's stock price might be vulnerable to their trading decisions
- 42% of the business is held by the top 25 shareholders
- Insiders have sold recently
To get a sense of who is truly in control of Costco Wholesale Corporation (NASDAQ:COST), it is important to understand the ownership structure of the business. With 70% stake, institutions possess the maximum shares in the company. Put another way, the group faces the maximum upside potential (or downside risk).
Given the vast amount of money and research capacities at their disposal, institutional ownership tends to carry a lot of weight, especially with individual investors. As a result, a sizeable amount of institutional money invested in a firm is generally viewed as a positive attribute.
Let's delve deeper into each type of owner of Costco Wholesale, beginning with the chart below.
Check out our latest analysis for Costco Wholesale
What Does The Institutional Ownership Tell Us About Costco Wholesale?
Institutional investors commonly compare their own returns to the returns of a commonly followed index. So they generally do consider buying larger companies that are included in the relevant benchmark index.
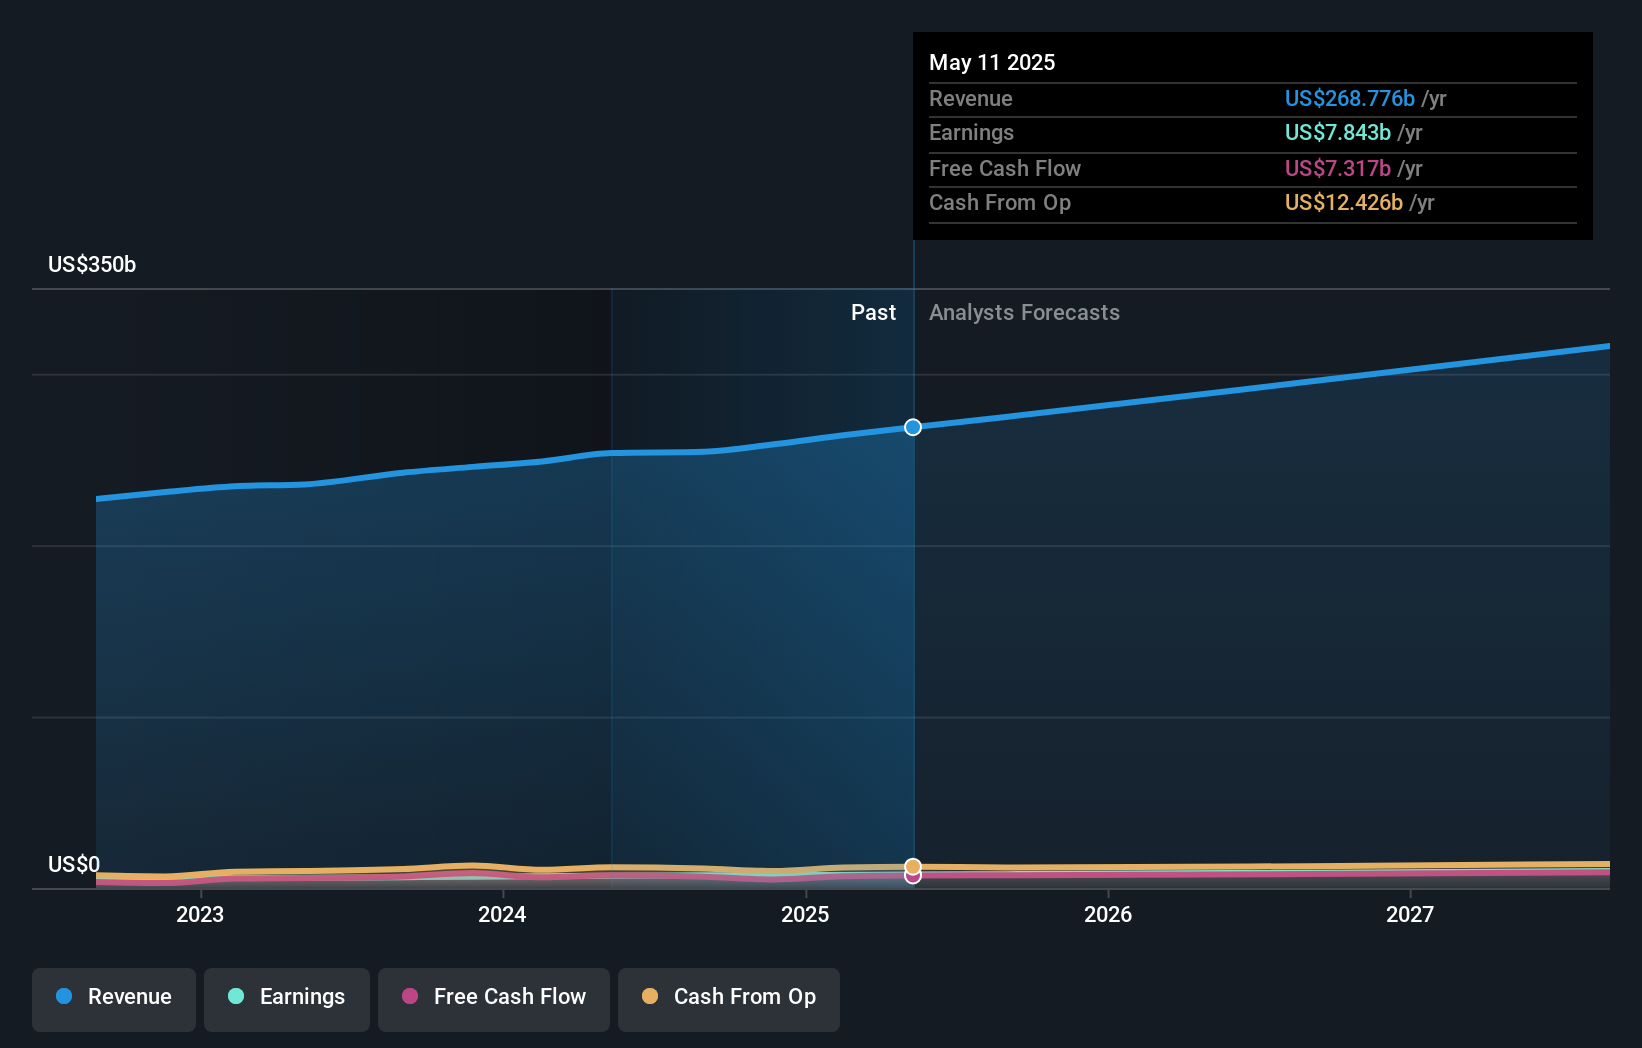
We can see that Costco Wholesale does have institutional investors; and they hold a good portion of the company's stock. This suggests some credibility amongst professional investors. But we can't rely on that fact alone since institutions make bad investments sometimes, just like everyone does. If multiple institutions change their view on a stock at the same time, you could see the share price drop fast. It's therefore worth looking at Costco Wholesale's earnings history below. Of course, the future is what really matters.
Institutional investors own over 50% of the company, so together than can probably strongly influence board decisions. Hedge funds don't have many shares in Costco Wholesale. Looking at our data, we can see that the largest shareholder is The Vanguard Group, Inc. with 9.6% of shares outstanding. BlackRock, Inc. is the second largest shareholder owning 7.9% of common stock, and State Street Global Advisors, Inc. holds about 4.1% of the company stock.
A deeper look at our ownership data shows that the top 25 shareholders collectively hold less than half of the register, suggesting a large group of small holders where no single shareholder has a majority.
Researching institutional ownership is a good way to gauge and filter a stock's expected performance. The same can be achieved by studying analyst sentiments. Quite a few analysts cover the stock, so you could look into forecast growth quite easily.
Insider Ownership Of Costco Wholesale
The definition of company insiders can be subjective and does vary between jurisdictions. Our data reflects individual insiders, capturing board members at the very least. The company management answer to the board and the latter should represent the interests of shareholders. Notably, sometimes top-level managers are on the board themselves.
I generally consider insider ownership to be a good thing. However, on some occasions it makes it more difficult for other shareholders to hold the board accountable for decisions.
Our most recent data indicates that insiders own less than 1% of Costco Wholesale Corporation. It is a very large company, so it would be surprising to see insiders own a large proportion of the company. Though their holding amounts to less than 1%, we can see that board members collectively own US$740m worth of shares (at current prices). Arguably recent buying and selling is just as important to consider. You can click here to see if insiders have been buying or selling.
General Public Ownership
With a 30% ownership, the general public, mostly comprising of individual investors, have some degree of sway over Costco Wholesale. While this group can't necessarily call the shots, it can certainly have a real influence on how the company is run.
Next Steps:
I find it very interesting to look at who exactly owns a company. But to truly gain insight, we need to consider other information, too. Consider risks, for instance. Every company has them, and we've spotted 1 warning sign for Costco Wholesale you should know about.
If you are like me, you may want to think about whether this company will grow or shrink. Luckily, you can check this free report showing analyst forecasts for its future.
NB: Figures in this article are calculated using data from the last twelve months, which refer to the 12-month period ending on the last date of the month the financial statement is dated. This may not be consistent with full year annual report figures.
Have feedback on this article? Concerned about the content? Get in touch with us directly. Alternatively, email editorial-team (at) simplywallst.com.
This article by Simply Wall St is general in nature. We provide commentary based on historical data and analyst forecasts only using an unbiased methodology and our articles are not intended to be financial advice. It does not constitute a recommendation to buy or sell any stock, and does not take account of your objectives, or your financial situation. We aim to bring you long-term focused analysis driven by fundamental data. Note that our analysis may not factor in the latest price-sensitive company announcements or qualitative material. Simply Wall St has no position in any stocks mentioned.