
- LIVE QUOTES
- LEARN
- HELP
 Wall Street Journal
EN
Empire Company Limited's (TSE:EMP.A) Fundamentals Look Pretty Strong: Could The Market Be Wrong About The Stock?
Empire (TSE:EMP.A) has had a rough week with its share price down 6.7%. However, the company's fundamentals look pretty decent, and long-term financials are usually aligned with future market price movements. Particularly, we will be paying attention to Empire's ROE today.
Return on equity or ROE is a key measure used to assess how efficiently a company's management is utilizing the company's capital. In other words, it is a profitability ratio which measures the rate of return on the capital provided by the company's shareholders.
How Do You Calculate Return On Equity?
The formula for ROE is:
Return on Equity = Net Profit (from continuing operations) ÷ Shareholders' Equity
So, based on the above formula, the ROE for Empire is:
13% = CA$746m ÷ CA$5.5b (Based on the trailing twelve months to May 2025).
The 'return' is the income the business earned over the last year. One way to conceptualize this is that for each CA$1 of shareholders' capital it has, the company made CA$0.13 in profit.
See our latest analysis for Empire
Why Is ROE Important For Earnings Growth?
So far, we've learned that ROE is a measure of a company's profitability. We now need to evaluate how much profit the company reinvests or "retains" for future growth which then gives us an idea about the growth potential of the company. Assuming everything else remains unchanged, the higher the ROE and profit retention, the higher the growth rate of a company compared to companies that don't necessarily bear these characteristics.
Empire's Earnings Growth And 13% ROE
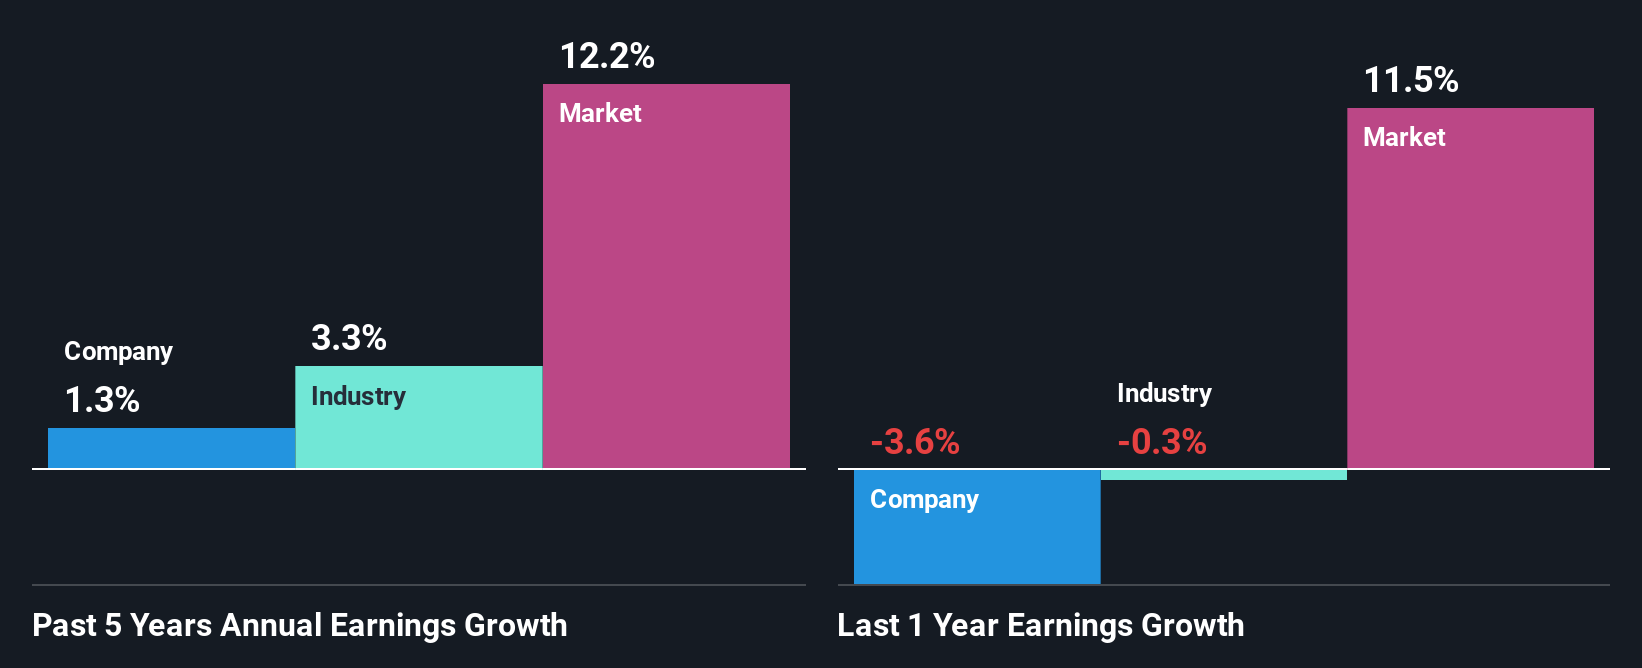
At first glance, Empire seems to have a decent ROE. Even when compared to the industry average of 16% the company's ROE looks quite decent. Despite this, Empire's five year net income growth was quite flat over the past five years. Based on this, we feel that there might be other reasons which haven't been discussed so far in this article that could be hampering the company's growth. Such as, the company pays out a huge portion of its earnings as dividends, or is faced with competitive pressures.
We then compared Empire's net income growth with the industry and found that the company's growth figure is lower than the average industry growth rate of 3.3% in the same 5-year period, which is a bit concerning.
Earnings growth is a huge factor in stock valuation. The investor should try to establish if the expected growth or decline in earnings, whichever the case may be, is priced in. Doing so will help them establish if the stock's future looks promising or ominous. Is Empire fairly valued compared to other companies? These 3 valuation measures might help you decide.
Is Empire Using Its Retained Earnings Effectively?
Empire's low three-year median payout ratio of 25% (implying that the company keeps75% of its income) should mean that the company is retaining most of its earnings to fuel its growth and this should be reflected in its growth number, but that's not the case.
Moreover, Empire has been paying dividends for at least ten years or more suggesting that management must have perceived that the shareholders prefer dividends over earnings growth.
Summary
In total, it does look like Empire has some positive aspects to its business. Although, we are disappointed to see a lack of growth in earnings even in spite of a high ROE and and a high reinvestment rate. We believe that there might be some outside factors that could be having a negative impact on the business. Until now, we have only just grazed the surface of the company's past performance by looking at the company's fundamentals. So it may be worth checking this free detailed graph of Empire's past earnings, as well as revenue and cash flows to get a deeper insight into the company's performance.
Have feedback on this article? Concerned about the content? Get in touch with us directly. Alternatively, email editorial-team (at) simplywallst.com.
This article by Simply Wall St is general in nature. We provide commentary based on historical data and analyst forecasts only using an unbiased methodology and our articles are not intended to be financial advice. It does not constitute a recommendation to buy or sell any stock, and does not take account of your objectives, or your financial situation. We aim to bring you long-term focused analysis driven by fundamental data. Note that our analysis may not factor in the latest price-sensitive company announcements or qualitative material. Simply Wall St has no position in any stocks mentioned.