
- LIVE QUOTES
- LEARN
- HELP
 Wall Street Journal
EN
Is Lynas Rare Earths Set for More Gains After White House Price Support Move?
Approach 1: Lynas Rare Earths Cash Flows
The Discounted Cash Flow (DCF) model is a classic tool for estimating a company's true worth by projecting its future free cash flows and discounting them back to their present value. This approach provides a clear sense of what the business could be worth today based on expected performance in the years ahead.
For Lynas Rare Earths, the last twelve months have seen negative free cash flow of about A$287 million. However, analysts expect a rapid turnaround, projecting free cash flow to rise steadily and reach approximately A$946 million by 2030. Year by year, the estimates reflect robust growth, with discounted cash flows building from A$154 million in 2026 up to roughly A$460 million by 2035.
Based on these projections, the DCF model assigns Lynas an intrinsic value of about A$19.05 per share. Given current market prices, this translates to the stock being 24.9% undervalued according to this method. The margin is meaningful and suggests some upside potential for investors if these cash flow forecasts prove accurate.
Result: UNDERVALUED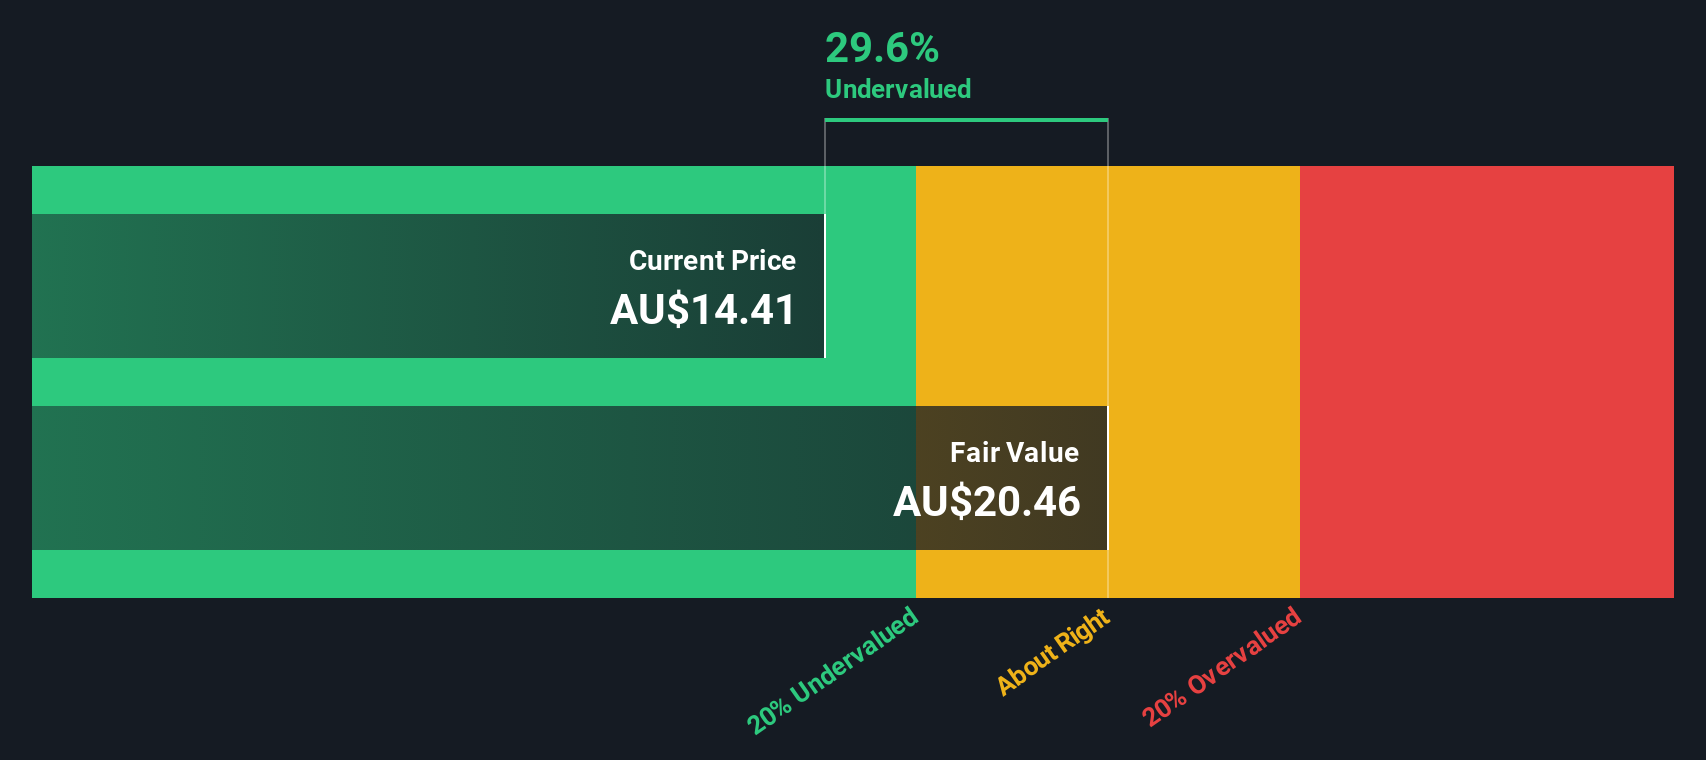
Approach 2: Lynas Rare Earths Price vs Sales
For companies where consistent profits can be volatile or cyclical, the Price-to-Sales (P/S) ratio often serves as the preferred valuation multiple. This is especially true in sectors such as metals and mining. By examining a company's market value relative to its revenue, the P/S ratio helps investors assess whether a stock is expensive or reasonably priced, regardless of one-time impacts on profitability.
The definition of a fair P/S ratio depends on expectations for future growth and the level of underlying risk. Companies with stronger top-line growth and lower risk often justify higher P/S ratios, while businesses with slower growth or higher risk tend to trade at a discount to their peers.
Lynas Rare Earths currently trades at a P/S ratio of 27.73x, which is far above the industry average of 70.17x and also higher than the average peer group at 3.92x. Simply Wall St’s Fair Ratio, a proprietary benchmark that considers Lynas’s sales growth, market dynamics, margins, and risk profile, is 3.80x.
This indicates that Lynas’s current P/S multiple is well above what would generally be considered fair by most metrics. It suggests the market is already factoring in very optimistic expectations. In summary, by the P/S ratio, Lynas Rare Earths stock appears overvalued at current prices.
Result: OVERVALUED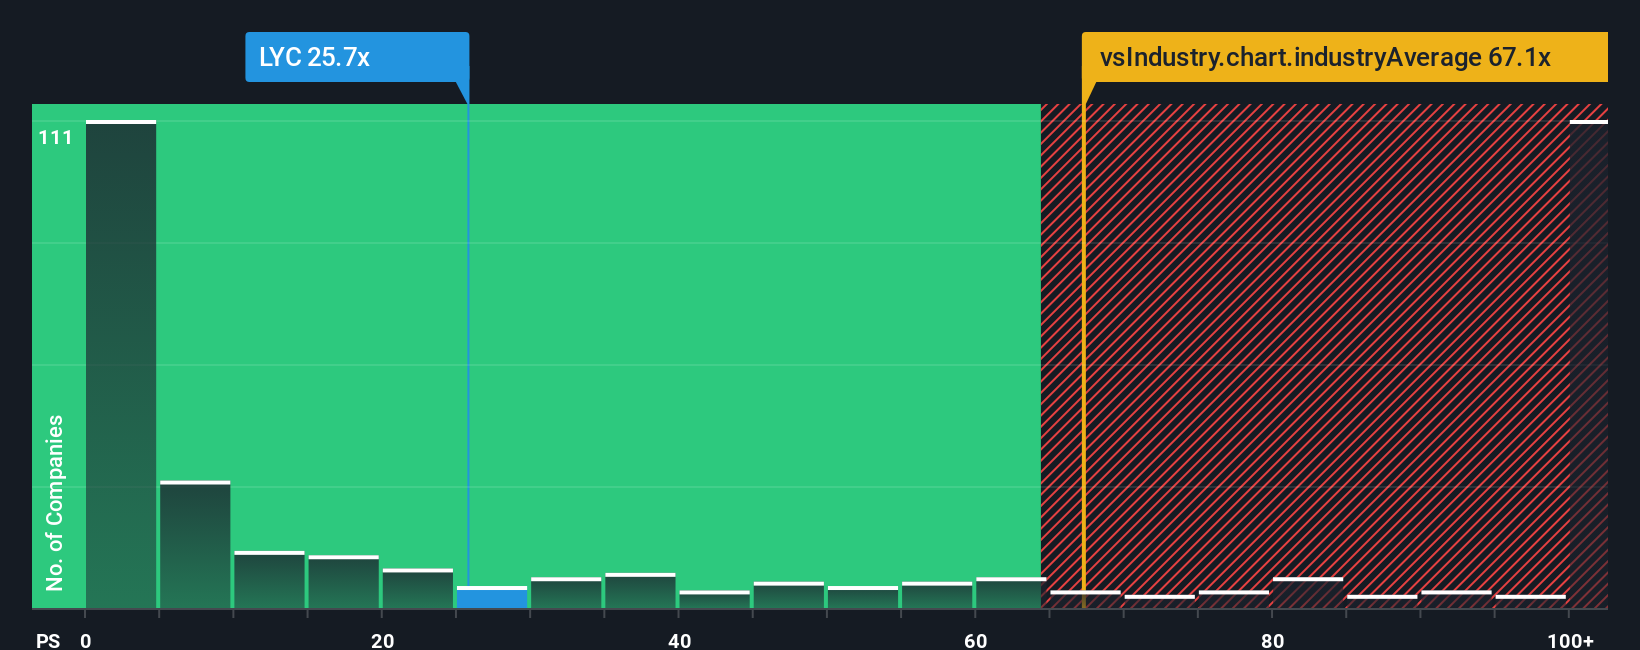
Upgrade Your Decision Making: Choose your Lynas Rare Earths Narrative
While traditional valuation tools offer important insights, investors are increasingly turning to Narratives—simple but powerful stories that put a company's numbers in context by connecting your outlook on its future (such as revenue, profit margins, and fair value) to your investment decisions.
A Narrative outlines your personal thesis for a stock, linking Lynas Rare Earths’s real-world story with concrete financial forecasts, then translating those into your own fair value. Narratives are accessible and shareable on the Simply Wall St platform, where millions of investors post, compare, and refine their perspectives.
This approach helps you look past headline numbers, providing a fuller picture by dynamically updating your Narrative as new developments or earnings reports are released. With Narratives, you can decide when to buy or sell based on whether your fair value estimate is above or below today’s price, and quickly adjust as new information emerges.
For example, one Lynas Rare Earths Narrative might estimate future earnings at A$855 million and a price target of A$13.25. In contrast, a more cautious view might project A$362.4 million in earnings and a lower price target of A$5.50.
Do you think there's more to the story for Lynas Rare Earths? Create your own Narrative to let the Community know!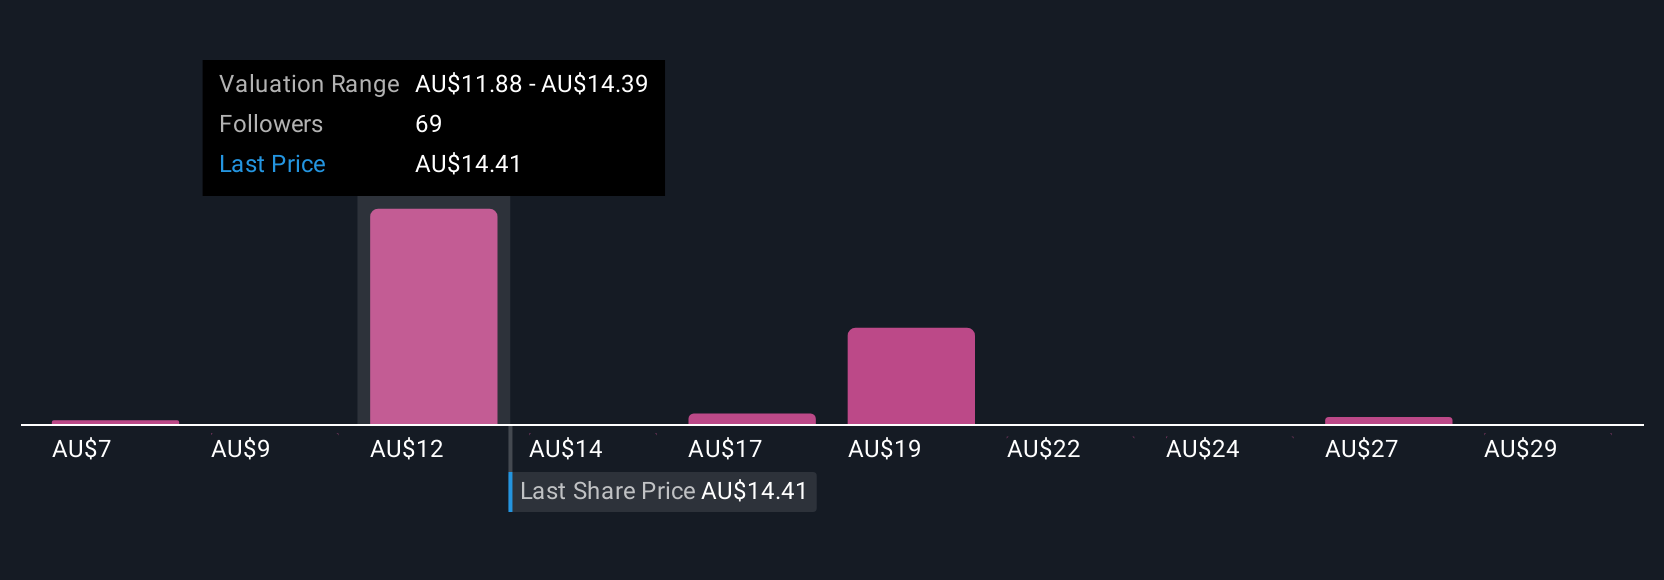
This article by Simply Wall St is general in nature. We provide commentary based on historical data and analyst forecasts only using an unbiased methodology and our articles are not intended to be financial advice. It does not constitute a recommendation to buy or sell any stock, and does not take account of your objectives, or your financial situation. We aim to bring you long-term focused analysis driven by fundamental data. Note that our analysis may not factor in the latest price-sensitive company announcements or qualitative material. Simply Wall St has no position in any stocks mentioned.
Have feedback on this article? Concerned about the content? Get in touch with us directly. Alternatively, email editorial-team@simplywallst.com