
- LIVE QUOTES
- LEARN
- HELP
 Wall Street Journal
EN
With 88% institutional ownership, Textron Inc. (NYSE:TXT) is a favorite amongst the big guns
Key Insights
- Institutions' substantial holdings in Textron implies that they have significant influence over the company's share price
- 50% of the business is held by the top 10 shareholders
- Using data from analyst forecasts alongside ownership research, one can better assess the future performance of a company
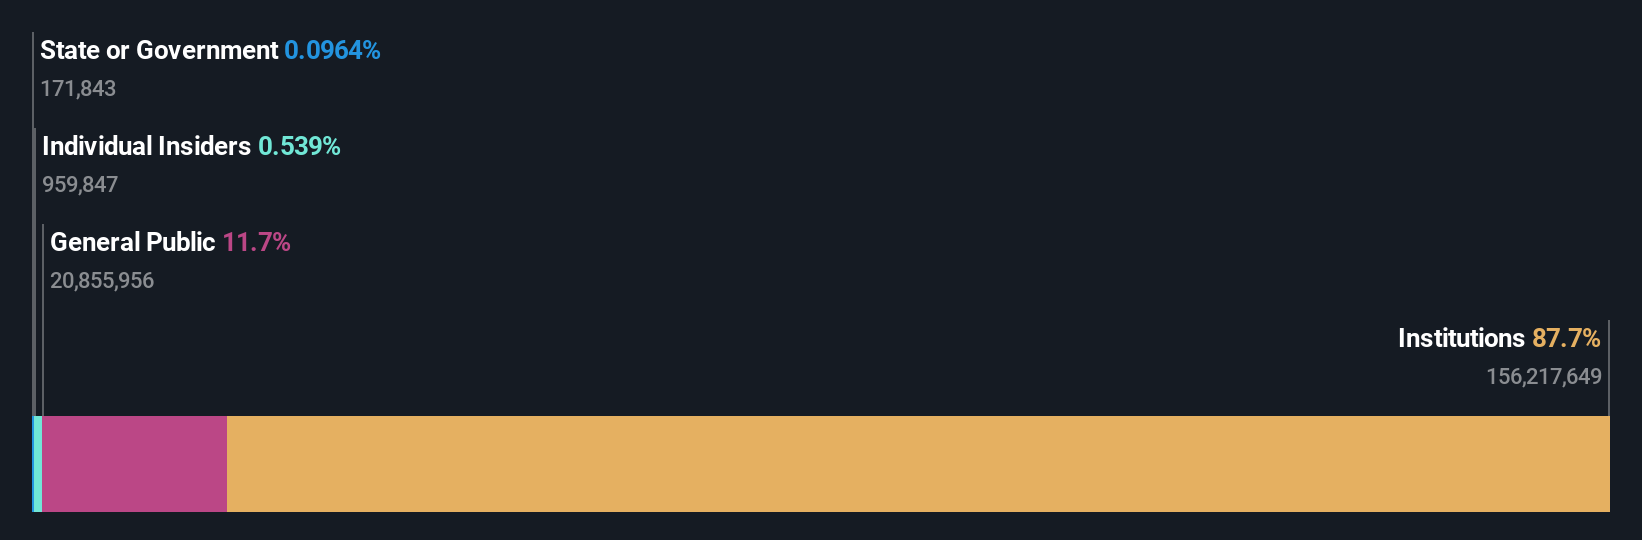
A look at the shareholders of Textron Inc. (NYSE:TXT) can tell us which group is most powerful. We can see that institutions own the lion's share in the company with 88% ownership. Put another way, the group faces the maximum upside potential (or downside risk).
Because institutional owners have a huge pool of resources and liquidity, their investing decisions tend to carry a great deal of weight, especially with individual investors. Therefore, a good portion of institutional money invested in the company is usually a huge vote of confidence on its future.
Let's take a closer look to see what the different types of shareholders can tell us about Textron.
View our latest analysis for Textron
What Does The Institutional Ownership Tell Us About Textron?
Institutions typically measure themselves against a benchmark when reporting to their own investors, so they often become more enthusiastic about a stock once it's included in a major index. We would expect most companies to have some institutions on the register, especially if they are growing.
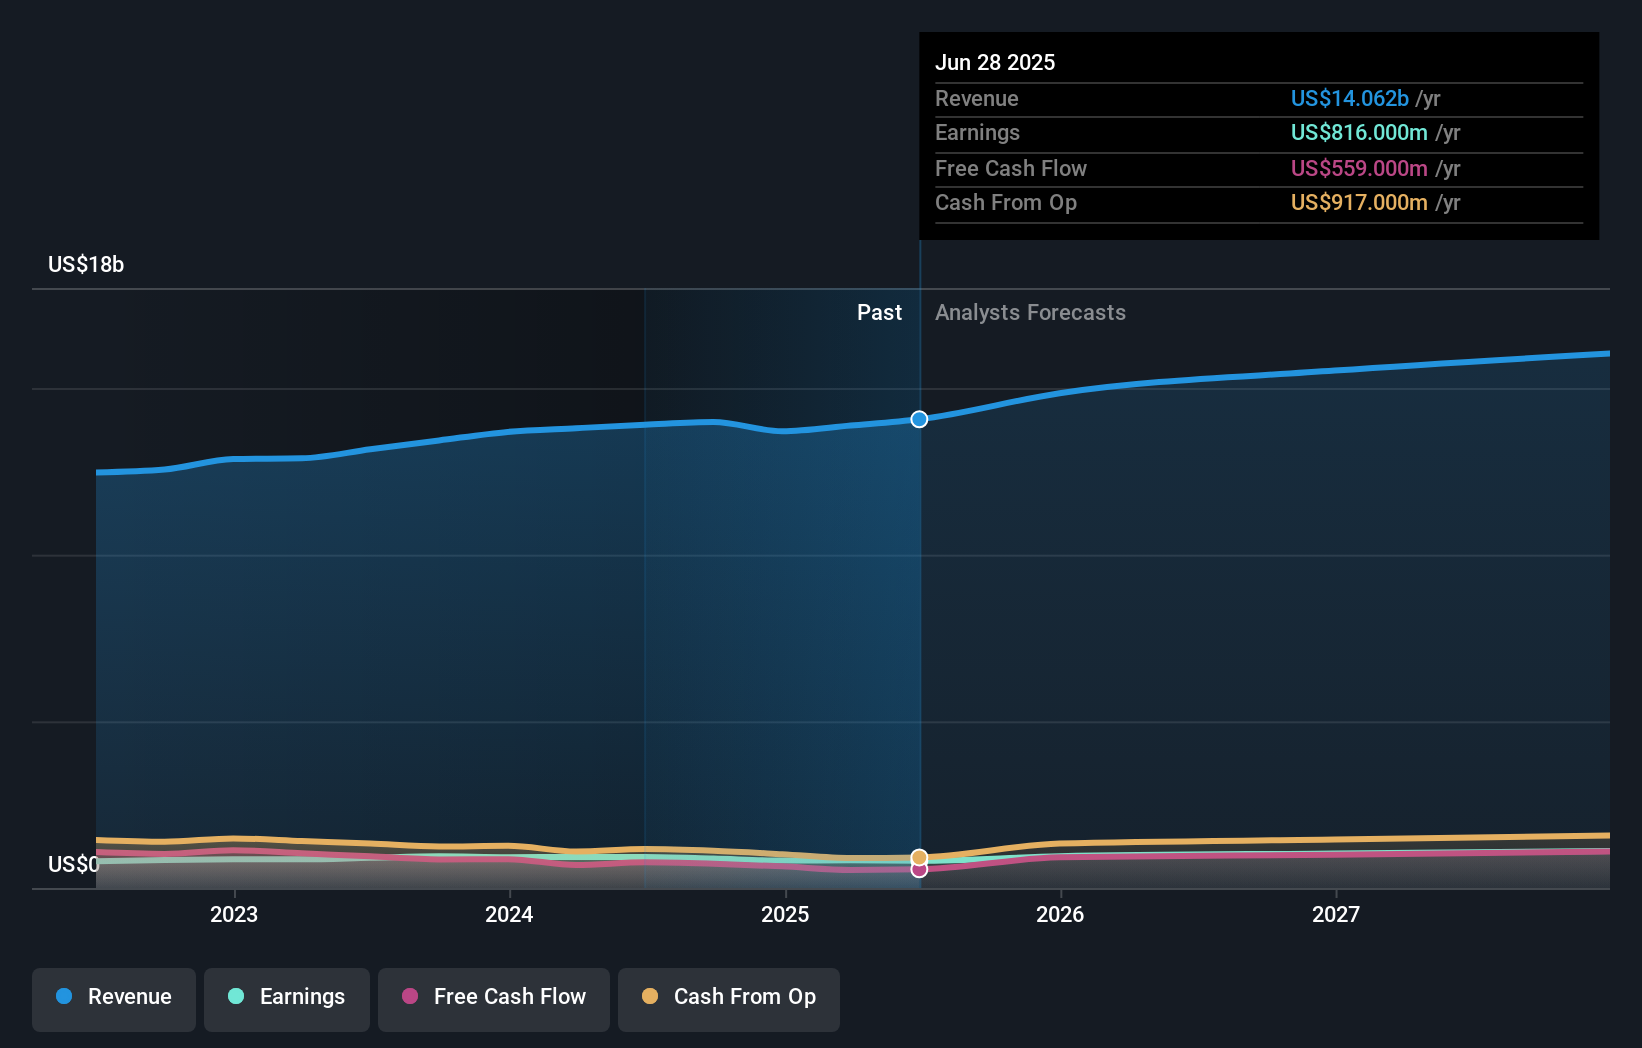
We can see that Textron does have institutional investors; and they hold a good portion of the company's stock. This suggests some credibility amongst professional investors. But we can't rely on that fact alone since institutions make bad investments sometimes, just like everyone does. If multiple institutions change their view on a stock at the same time, you could see the share price drop fast. It's therefore worth looking at Textron's earnings history below. Of course, the future is what really matters.
Institutional investors own over 50% of the company, so together than can probably strongly influence board decisions. We note that hedge funds don't have a meaningful investment in Textron. The Vanguard Group, Inc. is currently the company's largest shareholder with 12% of shares outstanding. For context, the second largest shareholder holds about 8.4% of the shares outstanding, followed by an ownership of 7.8% by the third-largest shareholder.
On further inspection, we found that more than half the company's shares are owned by the top 10 shareholders, suggesting that the interests of the larger shareholders are balanced out to an extent by the smaller ones.
Researching institutional ownership is a good way to gauge and filter a stock's expected performance. The same can be achieved by studying analyst sentiments. There are plenty of analysts covering the stock, so it might be worth seeing what they are forecasting, too.
Insider Ownership Of Textron
The definition of an insider can differ slightly between different countries, but members of the board of directors always count. Company management run the business, but the CEO will answer to the board, even if he or she is a member of it.
Most consider insider ownership a positive because it can indicate the board is well aligned with other shareholders. However, on some occasions too much power is concentrated within this group.
Our information suggests that Textron Inc. insiders own under 1% of the company. As it is a large company, we'd only expect insiders to own a small percentage of it. But it's worth noting that they own US$74m worth of shares. Arguably recent buying and selling is just as important to consider. You can click here to see if insiders have been buying or selling.
General Public Ownership
With a 12% ownership, the general public, mostly comprising of individual investors, have some degree of sway over Textron. While this size of ownership may not be enough to sway a policy decision in their favour, they can still make a collective impact on company policies.
Next Steps:
I find it very interesting to look at who exactly owns a company. But to truly gain insight, we need to consider other information, too.
I always like to check for a history of revenue growth. You can too, by accessing this free chart of historic revenue and earnings in this detailed graph.
If you would prefer discover what analysts are predicting in terms of future growth, do not miss this free report on analyst forecasts.
NB: Figures in this article are calculated using data from the last twelve months, which refer to the 12-month period ending on the last date of the month the financial statement is dated. This may not be consistent with full year annual report figures.
Have feedback on this article? Concerned about the content? Get in touch with us directly. Alternatively, email editorial-team (at) simplywallst.com.
This article by Simply Wall St is general in nature. We provide commentary based on historical data and analyst forecasts only using an unbiased methodology and our articles are not intended to be financial advice. It does not constitute a recommendation to buy or sell any stock, and does not take account of your objectives, or your financial situation. We aim to bring you long-term focused analysis driven by fundamental data. Note that our analysis may not factor in the latest price-sensitive company announcements or qualitative material. Simply Wall St has no position in any stocks mentioned.