
- LIVE QUOTES
- LEARN
- HELP
 Wall Street Journal
EN
European Dividend Stocks To Enhance Your Portfolio
As the European markets navigate a landscape marked by tentative optimism around potential EU-U.S. trade agreements and steady interest rates from the European Central Bank, investors are keenly observing opportunities for growth and stability. In this environment, dividend stocks can offer a compelling proposition for enhancing portfolios by providing consistent income streams amidst fluctuating market conditions.
Top 10 Dividend Stocks In Europe
| Name | Dividend Yield | Dividend Rating |
| Zurich Insurance Group (SWX:ZURN) | 4.55% | ★★★★★★ |
| Rubis (ENXTPA:RUI) | 7.26% | ★★★★★★ |
| OVB Holding (XTRA:O4B) | 4.55% | ★★★★★★ |
| Les Docks des Pétroles d'Ambès -SA (ENXTPA:DPAM) | 5.67% | ★★★★★★ |
| Holcim (SWX:HOLN) | 4.79% | ★★★★★★ |
| HEXPOL (OM:HPOL B) | 4.93% | ★★★★★★ |
| ERG (BIT:ERG) | 5.27% | ★★★★★★ |
| DKSH Holding (SWX:DKSH) | 4.11% | ★★★★★★ |
| Banque Cantonale Vaudoise (SWX:BCVN) | 4.63% | ★★★★★★ |
| Allianz (XTRA:ALV) | 4.46% | ★★★★★★ |
Click here to see the full list of 227 stocks from our Top European Dividend Stocks screener.
Let's review some notable picks from our screened stocks.
HOMAG Group (DB:HG1)
Simply Wall St Dividend Rating: ★★★★☆☆
Overview: HOMAG Group AG, with a market cap of €420.44 million, manufactures and sells machines and solutions for the wood processing and timber construction industries worldwide.
Operations: HOMAG Group AG generates its revenue through the manufacturing and sale of machinery and solutions specifically designed for the wood processing and timber construction sectors on a global scale.
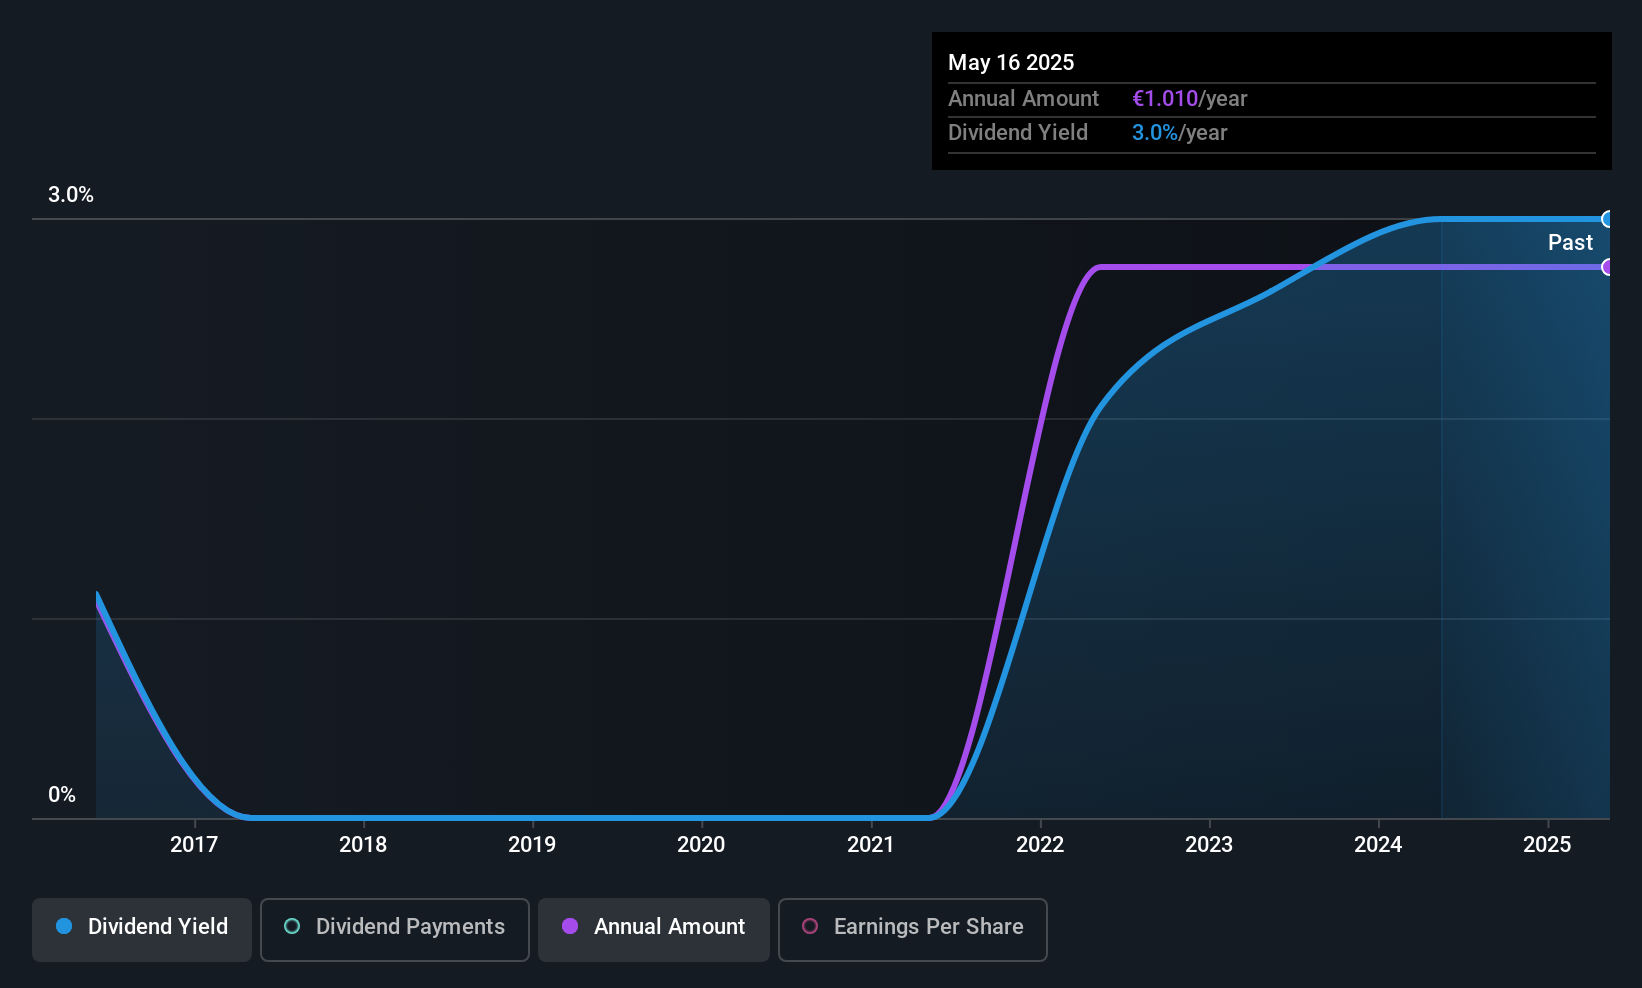
Dividend Yield: 3.7%
HOMAG Group offers a stable dividend, with payments consistently growing over the past decade. Despite lower profit margins this year and insufficient data on cash flow coverage, the dividend remains covered by earnings with a reasonable payout ratio of 50.5%. Although its yield of 3.69% is below the top tier in Germany, it provides reliability for investors seeking steady income. Recent financial results were impacted by significant one-off items.
- Navigate through the intricacies of HOMAG Group with our comprehensive dividend report here.
- Upon reviewing our latest valuation report, HOMAG Group's share price might be too optimistic.
Bank Polska Kasa Opieki (WSE:PEO)
Simply Wall St Dividend Rating: ★★★★☆☆
Overview: Bank Polska Kasa Opieki S.A. is a commercial bank offering banking products and services to retail and corporate clients in Poland, with a market cap of PLN53.68 billion.
Operations: Bank Polska Kasa Opieki S.A. generates revenue through its Business Banking segment (PLN2.51 billion) and Corporate and Investment Banking segment (PLN2.64 billion).
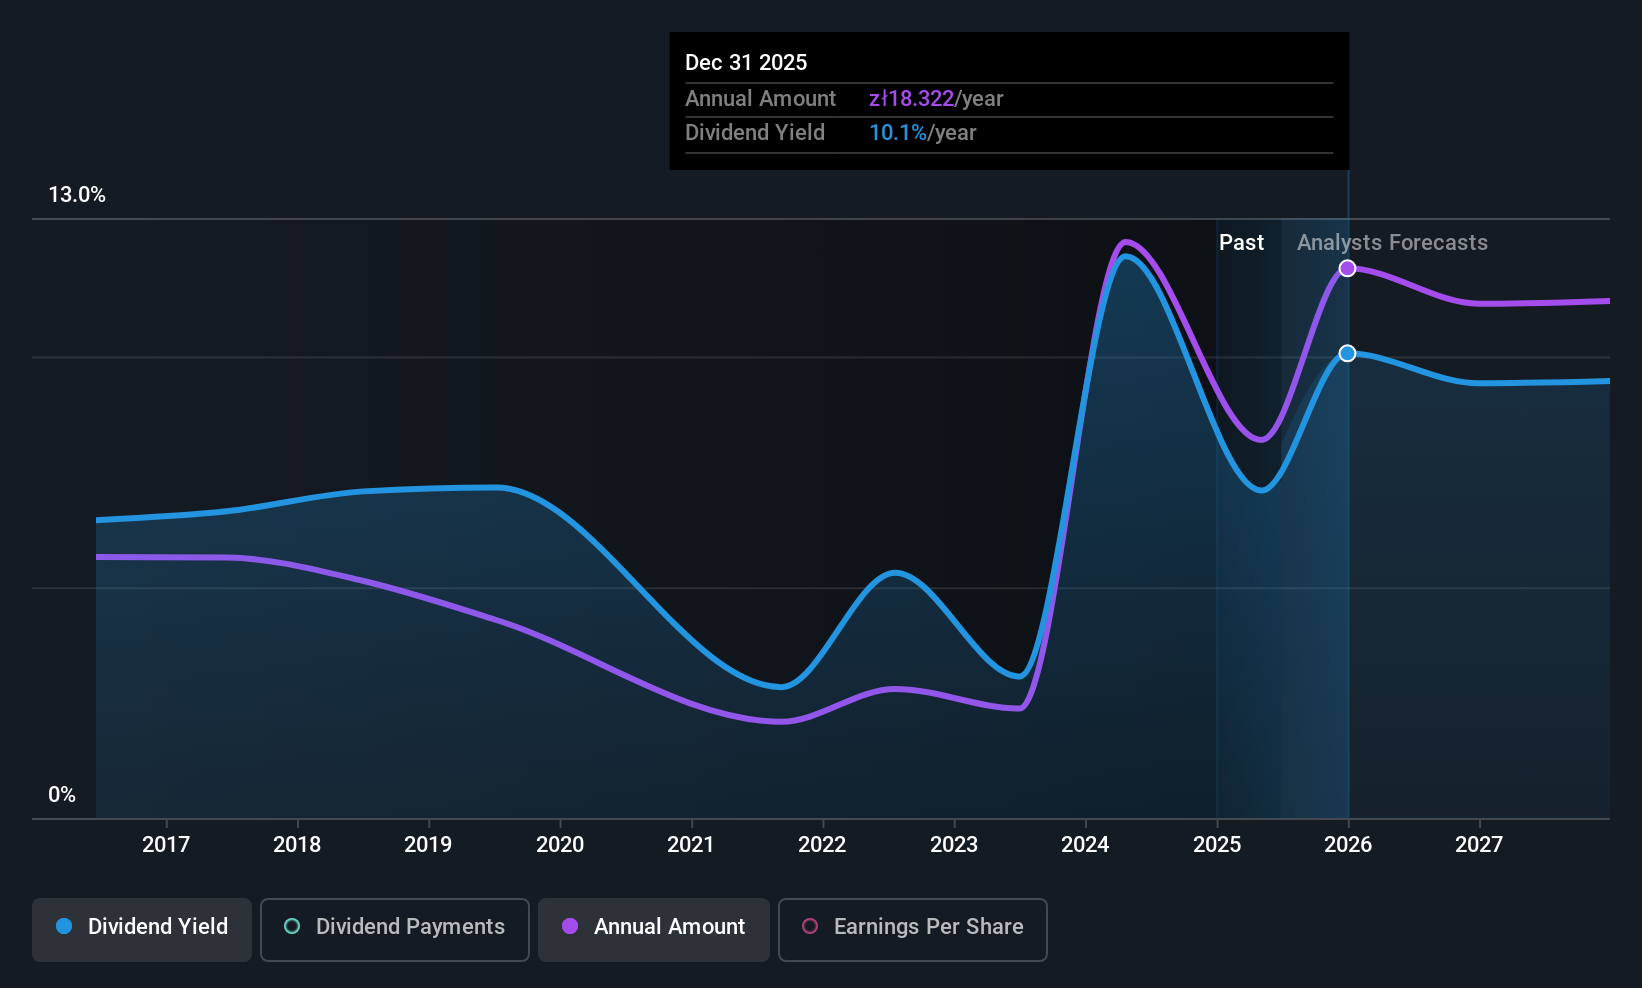
Dividend Yield: 6.2%
Bank Polska Kasa Opieki's dividend payments have increased over the past decade but remain volatile and unreliable. The current payout ratio of 50.5% suggests dividends are covered by earnings, though a forecasted decline in earnings may impact future coverage. Trading at 38.4% below estimated fair value, it offers relative good value compared to peers despite a lower yield of 6.16% against top Polish dividend payers. Recent financial results show improved net income and interest income year-on-year.
- Get an in-depth perspective on Bank Polska Kasa Opieki's performance by reading our dividend report here.
- Our comprehensive valuation report raises the possibility that Bank Polska Kasa Opieki is priced lower than what may be justified by its financials.
Santander Bank Polska (WSE:SPL)
Simply Wall St Dividend Rating: ★★★★★☆
Overview: Santander Bank Polska S.A. offers a range of banking products and services to individuals, SMEs, corporate clients, and public sector institutions, with a market cap of PLN56.41 billion.
Operations: Santander Bank Polska S.A.'s revenue is primarily derived from its segments, with Retail Banking generating PLN9.65 billion, Santander Consumer contributing PLN1.54 billion, Business and Corporate Banking bringing in PLN2.86 billion, and Corporate & Investment Banking accounting for PLN1.47 billion.
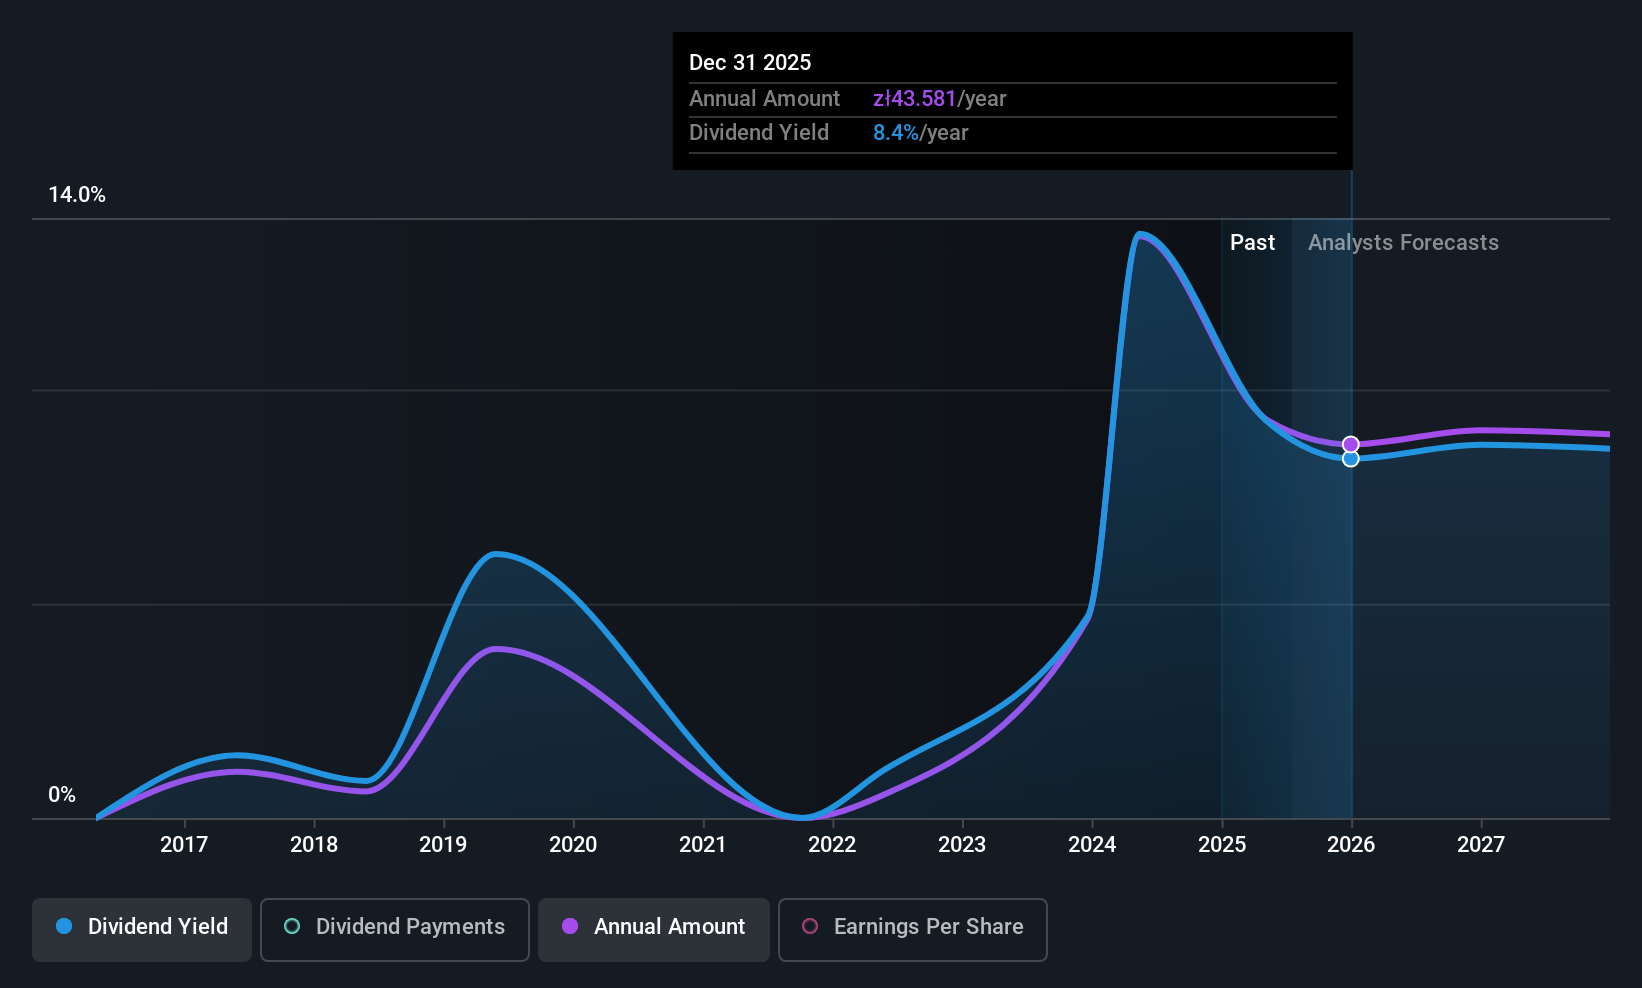
Dividend Yield: 8.4%
Santander Bank Polska's recent earnings report shows a significant rise in net income and earnings per share year-on-year, reflecting strong financial performance. Despite this, the bank's dividend track record is unstable and unreliable due to past volatility. The current payout ratio of 88.1% indicates dividends are covered by earnings; however, high non-performing loans at 4.1% present concerns. Trading below estimated fair value, it offers an attractive yield of 8.4%, ranking in the top tier within Poland's market.
- Take a closer look at Santander Bank Polska's potential here in our dividend report.
- The analysis detailed in our Santander Bank Polska valuation report hints at an deflated share price compared to its estimated value.
Next Steps
- Embark on your investment journey to our 227 Top European Dividend Stocks selection here.
- Already own these companies? Bring clarity to your investment decisions by linking up your portfolio with Simply Wall St, where you can monitor all the vital signs of your stocks effortlessly.
- Elevate your portfolio with Simply Wall St, the ultimate app for investors seeking global market coverage.
Looking For Alternative Opportunities?
- Explore high-performing small cap companies that haven't yet garnered significant analyst attention.
- Fuel your portfolio with companies showing strong growth potential, backed by optimistic outlooks both from analysts and management.
- Find companies with promising cash flow potential yet trading below their fair value.
This article by Simply Wall St is general in nature. We provide commentary based on historical data and analyst forecasts only using an unbiased methodology and our articles are not intended to be financial advice. It does not constitute a recommendation to buy or sell any stock, and does not take account of your objectives, or your financial situation. We aim to bring you long-term focused analysis driven by fundamental data. Note that our analysis may not factor in the latest price-sensitive company announcements or qualitative material. Simply Wall St has no position in any stocks mentioned.
Have feedback on this article? Concerned about the content? Get in touch with us directly. Alternatively, email editorial-team@simplywallst.com