
- LIVE QUOTES
- LEARN
- HELP
 Wall Street Journal
EN
The total return for National Presto Industries (NYSE:NPK) investors has risen faster than earnings growth over the last three years
Investors can buy low cost index fund if they want to receive the average market return. But in any diversified portfolio of stocks, you'll see some that fall short of the average. Unfortunately for shareholders, while the National Presto Industries, Inc. (NYSE:NPK) share price is up 36% in the last three years, that falls short of the market return. On the other hand, the more recent gain of 25% over a year is certainly pleasing.
Although National Presto Industries has shed US$61m from its market cap this week, let's take a look at its longer term fundamental trends and see if they've driven returns.
To paraphrase Benjamin Graham: Over the short term the market is a voting machine, but over the long term it's a weighing machine. One imperfect but simple way to consider how the market perception of a company has shifted is to compare the change in the earnings per share (EPS) with the share price movement.
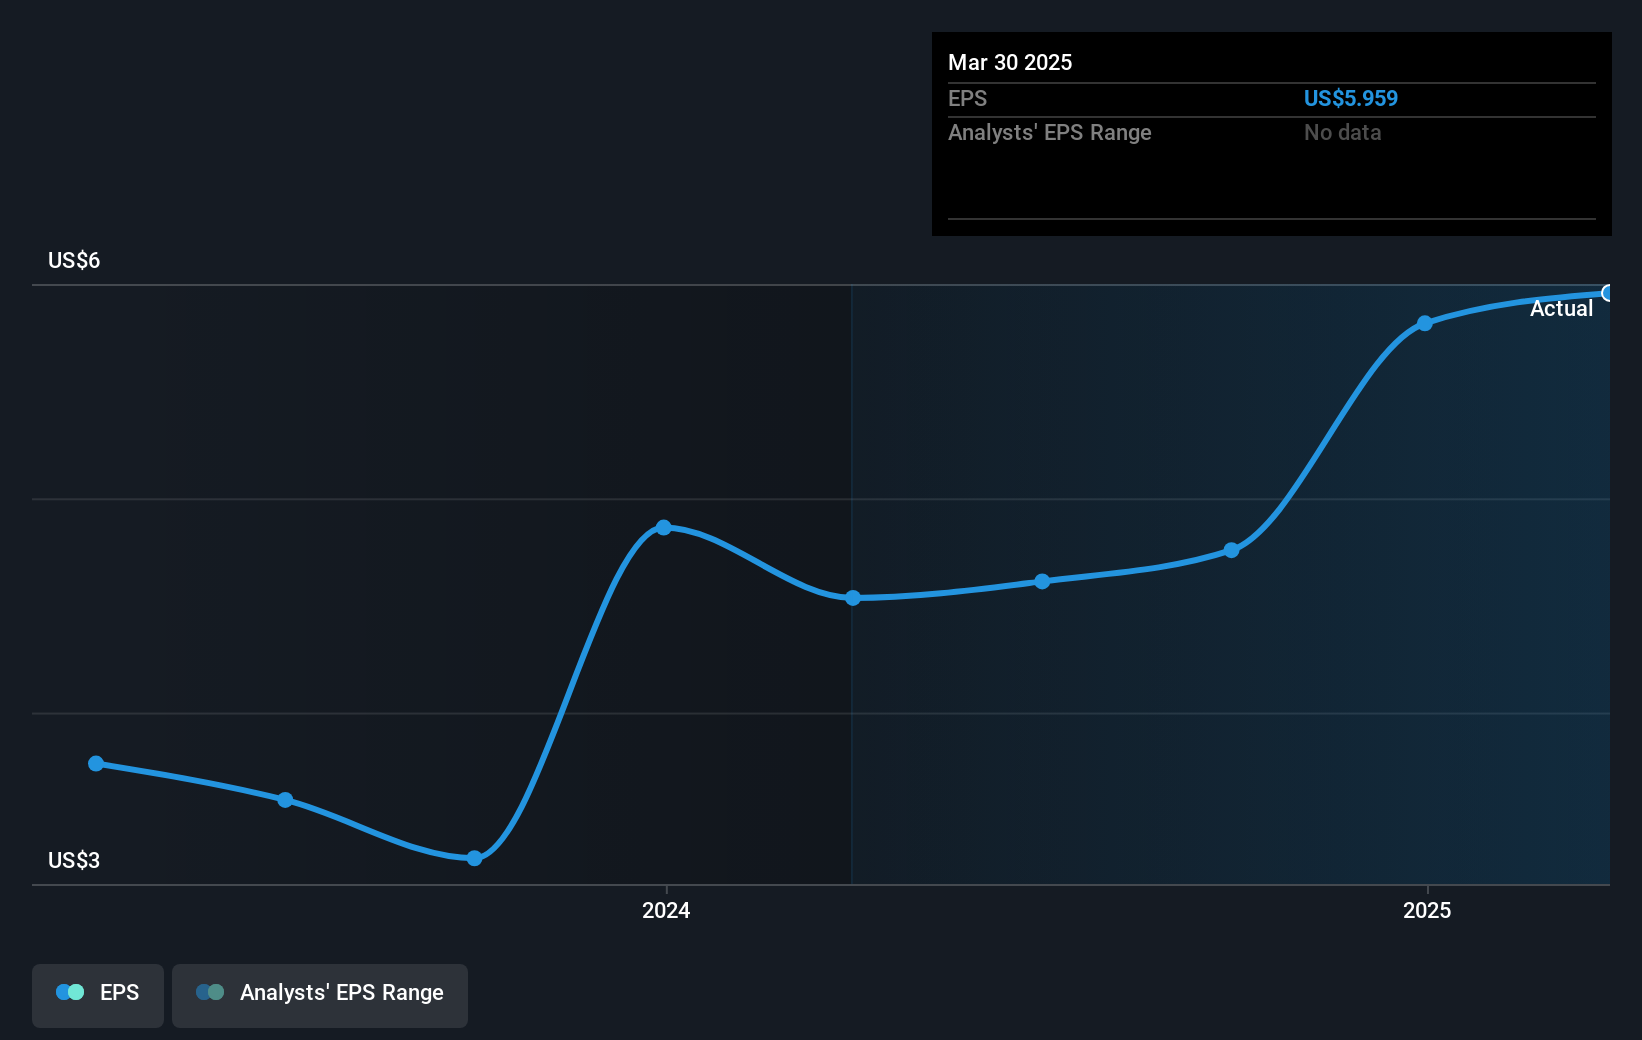
National Presto Industries was able to grow its EPS at 29% per year over three years, sending the share price higher. This EPS growth is higher than the 11% average annual increase in the share price. So it seems investors have become more cautious about the company, over time.
The image below shows how EPS has tracked over time (if you click on the image you can see greater detail).
It's probably worth noting that the CEO is paid less than the median at similar sized companies. But while CEO remuneration is always worth checking, the really important question is whether the company can grow earnings going forward. This free interactive report on National Presto Industries' earnings, revenue and cash flow is a great place to start, if you want to investigate the stock further.
What About Dividends?
When looking at investment returns, it is important to consider the difference between total shareholder return (TSR) and share price return. The TSR is a return calculation that accounts for the value of cash dividends (assuming that any dividend received was reinvested) and the calculated value of any discounted capital raisings and spin-offs. Arguably, the TSR gives a more comprehensive picture of the return generated by a stock. As it happens, National Presto Industries' TSR for the last 3 years was 53%, which exceeds the share price return mentioned earlier. The dividends paid by the company have thusly boosted the total shareholder return.
A Different Perspective
We're pleased to report that National Presto Industries shareholders have received a total shareholder return of 27% over one year. That's including the dividend. That's better than the annualised return of 7% over half a decade, implying that the company is doing better recently. Given the share price momentum remains strong, it might be worth taking a closer look at the stock, lest you miss an opportunity. I find it very interesting to look at share price over the long term as a proxy for business performance. But to truly gain insight, we need to consider other information, too. Consider for instance, the ever-present spectre of investment risk. We've identified 2 warning signs with National Presto Industries , and understanding them should be part of your investment process.
But note: National Presto Industries may not be the best stock to buy. So take a peek at this free list of interesting companies with past earnings growth (and further growth forecast).
Please note, the market returns quoted in this article reflect the market weighted average returns of stocks that currently trade on American exchanges.
Have feedback on this article? Concerned about the content? Get in touch with us directly. Alternatively, email editorial-team (at) simplywallst.com.
This article by Simply Wall St is general in nature. We provide commentary based on historical data and analyst forecasts only using an unbiased methodology and our articles are not intended to be financial advice. It does not constitute a recommendation to buy or sell any stock, and does not take account of your objectives, or your financial situation. We aim to bring you long-term focused analysis driven by fundamental data. Note that our analysis may not factor in the latest price-sensitive company announcements or qualitative material. Simply Wall St has no position in any stocks mentioned.