
- LIVE QUOTES
- LEARN
- HELP
 Wall Street Journal
EN
Rockwell Automation's (NYSE:ROK) three-year earnings growth trails the 19% YoY shareholder returns
Thanks in no small measure to Vanguard founder Jack Bogle, it's easy buy a low cost index fund, which should provide the average market return. But you can make superior returns by picking better-than average stocks. Notably, the Rockwell Automation, Inc. (NYSE:ROK) share price has gained 61% in three years, which is better than the average market return. It's also good to see a healthy gain of 32% in the last year.
Since the stock has added US$1.5b to its market cap in the past week alone, let's see if underlying performance has been driving long-term returns.
To paraphrase Benjamin Graham: Over the short term the market is a voting machine, but over the long term it's a weighing machine. One way to examine how market sentiment has changed over time is to look at the interaction between a company's share price and its earnings per share (EPS).
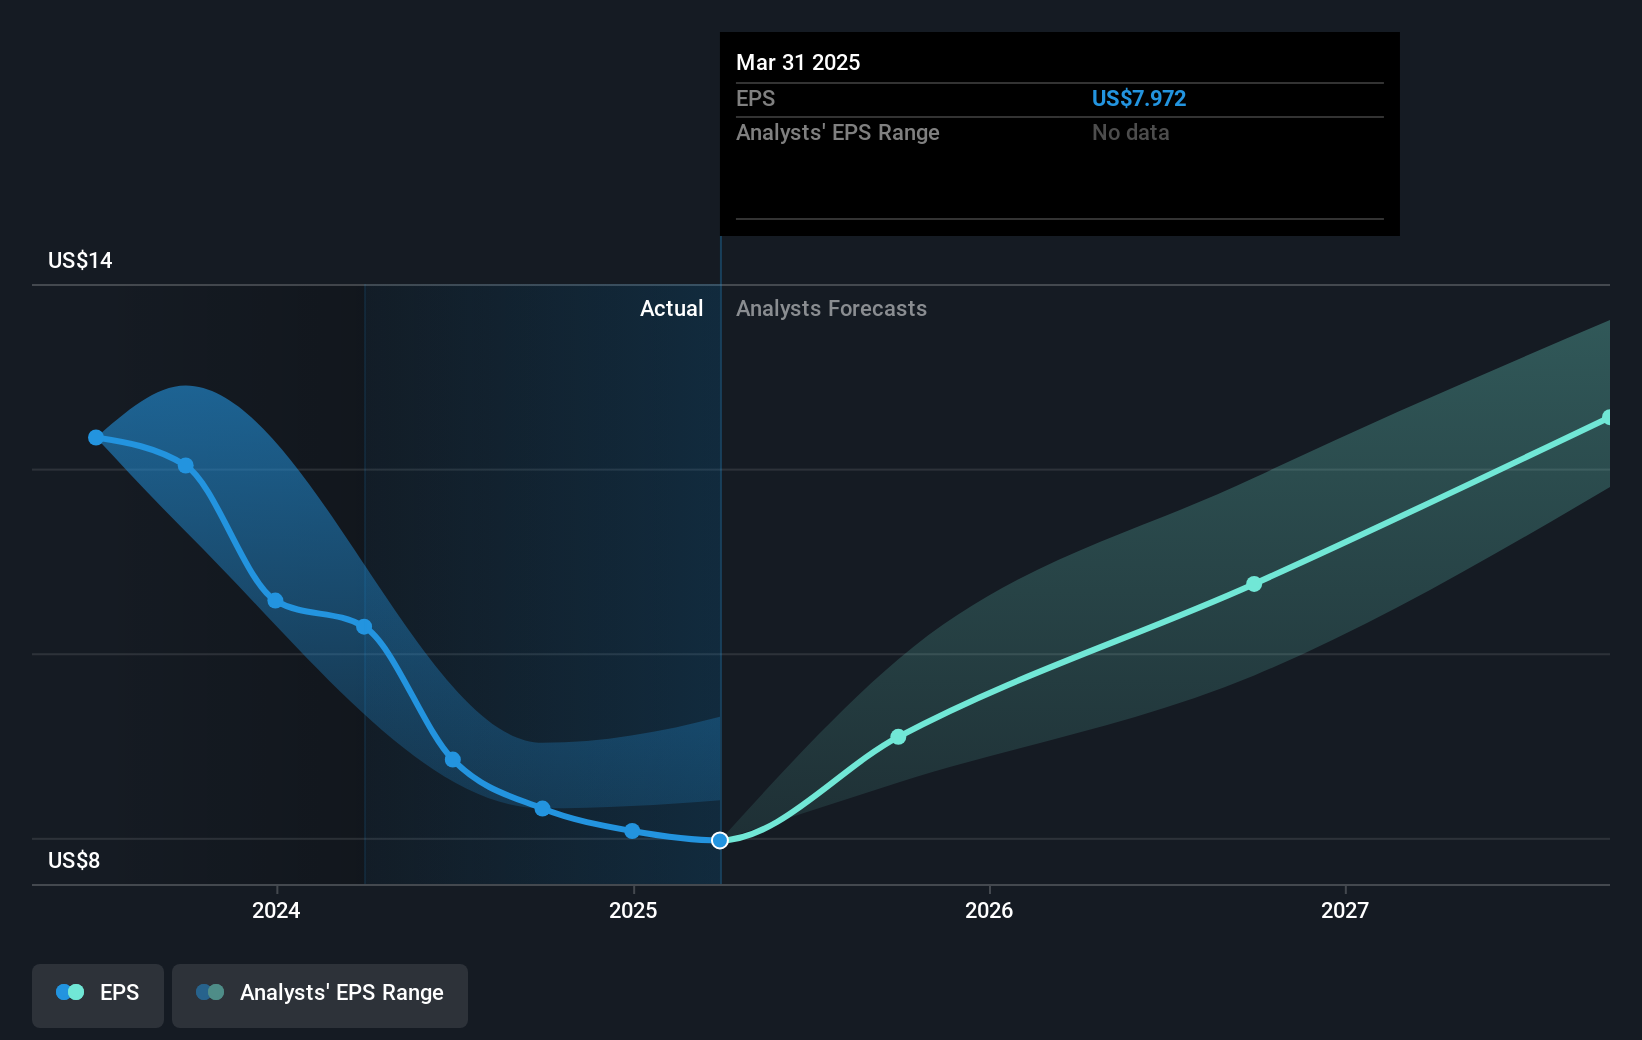
Rockwell Automation was able to grow its EPS at 13% per year over three years, sending the share price higher. This EPS growth is lower than the 17% average annual increase in the share price. So it's fair to assume the market has a higher opinion of the business than it did three years ago. It's not unusual to see the market 're-rate' a stock, after a few years of growth.
The graphic below depicts how EPS has changed over time (unveil the exact values by clicking on the image).
We like that insiders have been buying shares in the last twelve months. Having said that, most people consider earnings and revenue growth trends to be a more meaningful guide to the business. Before buying or selling a stock, we always recommend a close examination of historic growth trends, available here..
What About Dividends?
It is important to consider the total shareholder return, as well as the share price return, for any given stock. Whereas the share price return only reflects the change in the share price, the TSR includes the value of dividends (assuming they were reinvested) and the benefit of any discounted capital raising or spin-off. Arguably, the TSR gives a more comprehensive picture of the return generated by a stock. We note that for Rockwell Automation the TSR over the last 3 years was 69%, which is better than the share price return mentioned above. This is largely a result of its dividend payments!
A Different Perspective
It's good to see that Rockwell Automation has rewarded shareholders with a total shareholder return of 34% in the last twelve months. That's including the dividend. That gain is better than the annual TSR over five years, which is 11%. Therefore it seems like sentiment around the company has been positive lately. In the best case scenario, this may hint at some real business momentum, implying that now could be a great time to delve deeper. It's always interesting to track share price performance over the longer term. But to understand Rockwell Automation better, we need to consider many other factors. For instance, we've identified 1 warning sign for Rockwell Automation that you should be aware of.
If you like to buy stocks alongside management, then you might just love this free list of companies. (Hint: most of them are flying under the radar).
Please note, the market returns quoted in this article reflect the market weighted average returns of stocks that currently trade on American exchanges.
Have feedback on this article? Concerned about the content? Get in touch with us directly. Alternatively, email editorial-team (at) simplywallst.com.
This article by Simply Wall St is general in nature. We provide commentary based on historical data and analyst forecasts only using an unbiased methodology and our articles are not intended to be financial advice. It does not constitute a recommendation to buy or sell any stock, and does not take account of your objectives, or your financial situation. We aim to bring you long-term focused analysis driven by fundamental data. Note that our analysis may not factor in the latest price-sensitive company announcements or qualitative material. Simply Wall St has no position in any stocks mentioned.