
- LIVE QUOTES
- LEARN
- HELP
 Wall Street Journal
EN
Institutional investors are Dime Community Bancshares, Inc.'s (NASDAQ:DCOM) biggest bettors and were rewarded after last week's US$110m market cap gain
Key Insights
- Given the large stake in the stock by institutions, Dime Community Bancshares' stock price might be vulnerable to their trading decisions
- A total of 10 investors have a majority stake in the company with 50% ownership
- Insiders have been selling lately
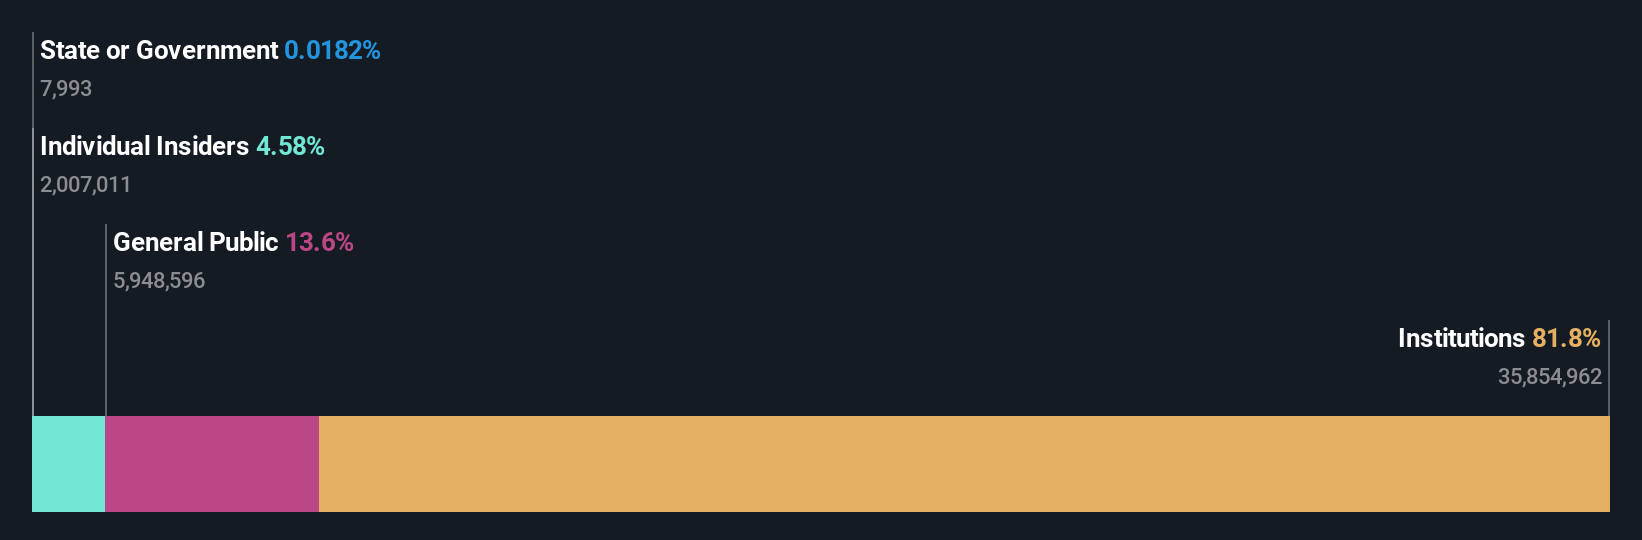
Every investor in Dime Community Bancshares, Inc. (NASDAQ:DCOM) should be aware of the most powerful shareholder groups. The group holding the most number of shares in the company, around 82% to be precise, is institutions. In other words, the group stands to gain the most (or lose the most) from their investment into the company.
Last week’s 9.7% gain means that institutional investors were on the positive end of the spectrum even as the company has shown strong longer-term trends. The one-year return on investment is currently 49% and last week's gain would have been more than welcomed.
In the chart below, we zoom in on the different ownership groups of Dime Community Bancshares.
Check out our latest analysis for Dime Community Bancshares
What Does The Institutional Ownership Tell Us About Dime Community Bancshares?
Many institutions measure their performance against an index that approximates the local market. So they usually pay more attention to companies that are included in major indices.
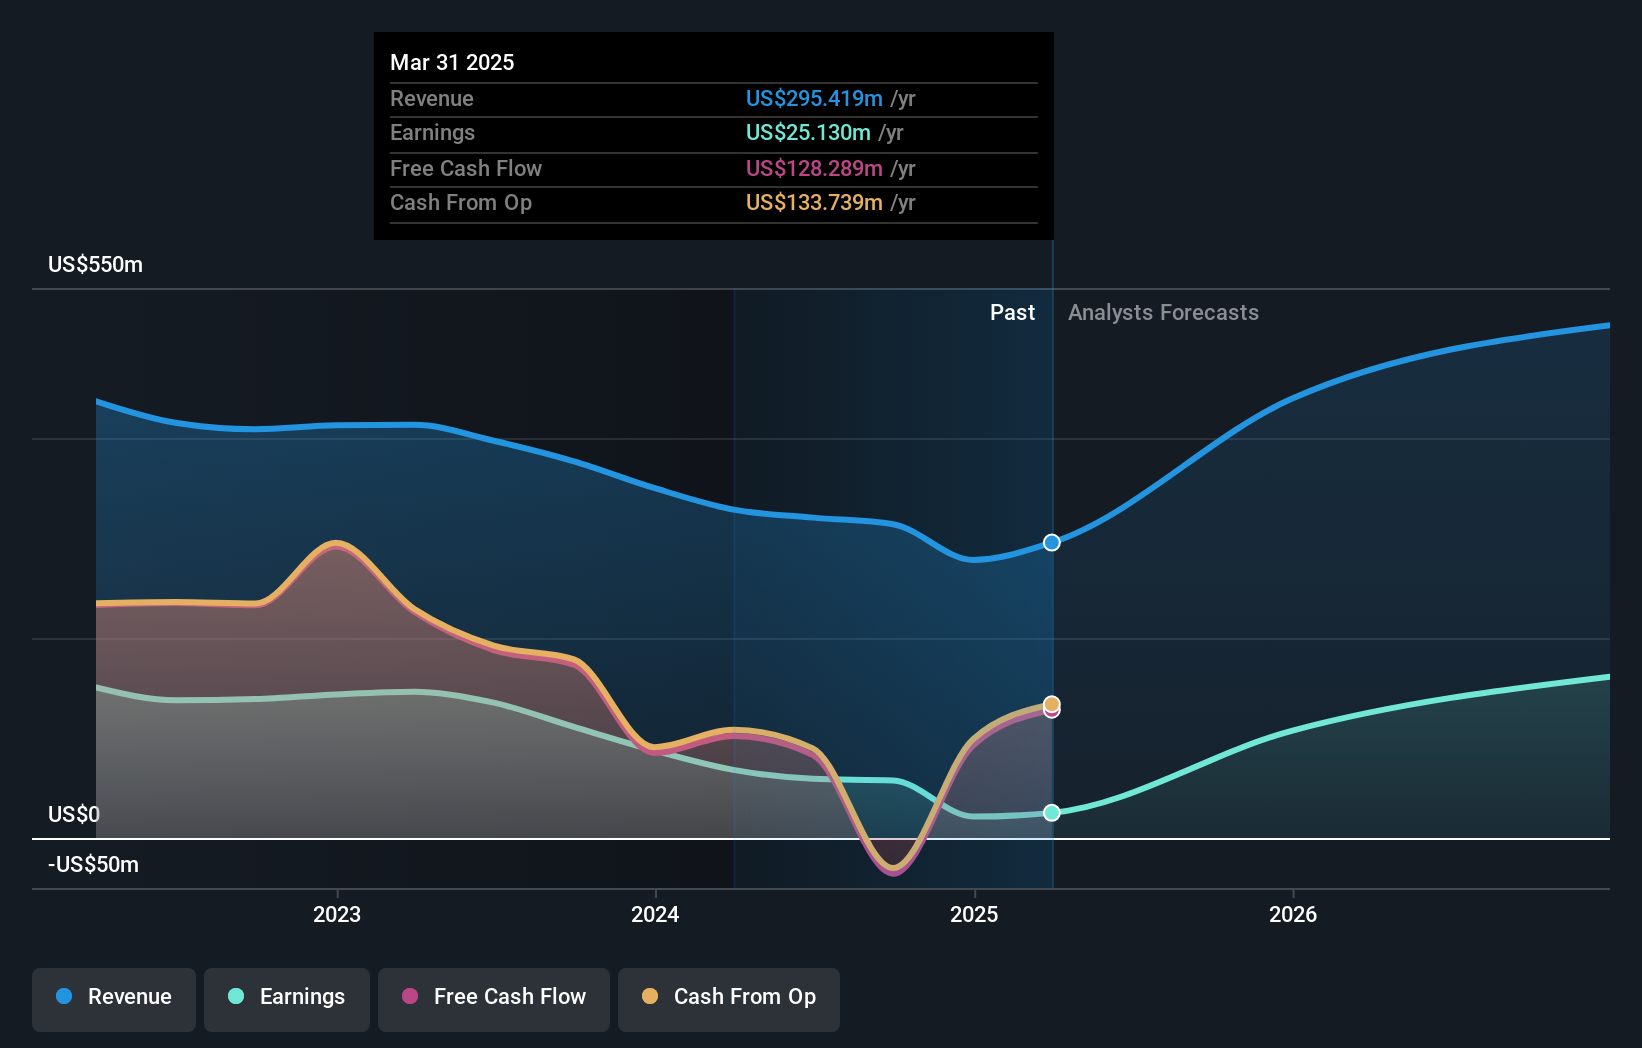
As you can see, institutional investors have a fair amount of stake in Dime Community Bancshares. This implies the analysts working for those institutions have looked at the stock and they like it. But just like anyone else, they could be wrong. When multiple institutions own a stock, there's always a risk that they are in a 'crowded trade'. When such a trade goes wrong, multiple parties may compete to sell stock fast. This risk is higher in a company without a history of growth. You can see Dime Community Bancshares' historic earnings and revenue below, but keep in mind there's always more to the story.
Investors should note that institutions actually own more than half the company, so they can collectively wield significant power. We note that hedge funds don't have a meaningful investment in Dime Community Bancshares. The company's largest shareholder is BlackRock, Inc., with ownership of 14%. Meanwhile, the second and third largest shareholders, hold 6.3% and 5.5%, of the shares outstanding, respectively. In addition, we found that Stuart Lubow, the CEO has 0.6% of the shares allocated to their name.
We did some more digging and found that 10 of the top shareholders account for roughly 50% of the register, implying that along with larger shareholders, there are a few smaller shareholders, thereby balancing out each others interests somewhat.
Researching institutional ownership is a good way to gauge and filter a stock's expected performance. The same can be achieved by studying analyst sentiments. There are a reasonable number of analysts covering the stock, so it might be useful to find out their aggregate view on the future.
Insider Ownership Of Dime Community Bancshares
The definition of company insiders can be subjective and does vary between jurisdictions. Our data reflects individual insiders, capturing board members at the very least. The company management answer to the board and the latter should represent the interests of shareholders. Notably, sometimes top-level managers are on the board themselves.
Insider ownership is positive when it signals leadership are thinking like the true owners of the company. However, high insider ownership can also give immense power to a small group within the company. This can be negative in some circumstances.
Our most recent data indicates that insiders own some shares in Dime Community Bancshares, Inc.. The insiders have a meaningful stake worth US$56m. Most would see this as a real positive. It is good to see this level of investment by insiders. You can check here to see if those insiders have been buying recently.
General Public Ownership
The general public, who are usually individual investors, hold a 14% stake in Dime Community Bancshares. This size of ownership, while considerable, may not be enough to change company policy if the decision is not in sync with other large shareholders.
Next Steps:
While it is well worth considering the different groups that own a company, there are other factors that are even more important. For instance, we've identified 2 warning signs for Dime Community Bancshares that you should be aware of.
If you would prefer discover what analysts are predicting in terms of future growth, do not miss this free report on analyst forecasts.
NB: Figures in this article are calculated using data from the last twelve months, which refer to the 12-month period ending on the last date of the month the financial statement is dated. This may not be consistent with full year annual report figures.
Have feedback on this article? Concerned about the content? Get in touch with us directly. Alternatively, email editorial-team (at) simplywallst.com.
This article by Simply Wall St is general in nature. We provide commentary based on historical data and analyst forecasts only using an unbiased methodology and our articles are not intended to be financial advice. It does not constitute a recommendation to buy or sell any stock, and does not take account of your objectives, or your financial situation. We aim to bring you long-term focused analysis driven by fundamental data. Note that our analysis may not factor in the latest price-sensitive company announcements or qualitative material. Simply Wall St has no position in any stocks mentioned.