
- LIVE QUOTES
- LEARN
- HELP
 Wall Street Journal
EN
Brookfield Business Corporation's (NYSE:BBUC) high institutional ownership speaks for itself as stock continues to impress, up 6.4% over last week
Key Insights
- Institutions' substantial holdings in Brookfield Business implies that they have significant influence over the company's share price
- Brookfield Corporation owns 52% of the company
- Using data from company's past performance alongside ownership research, one can better assess the future performance of a company
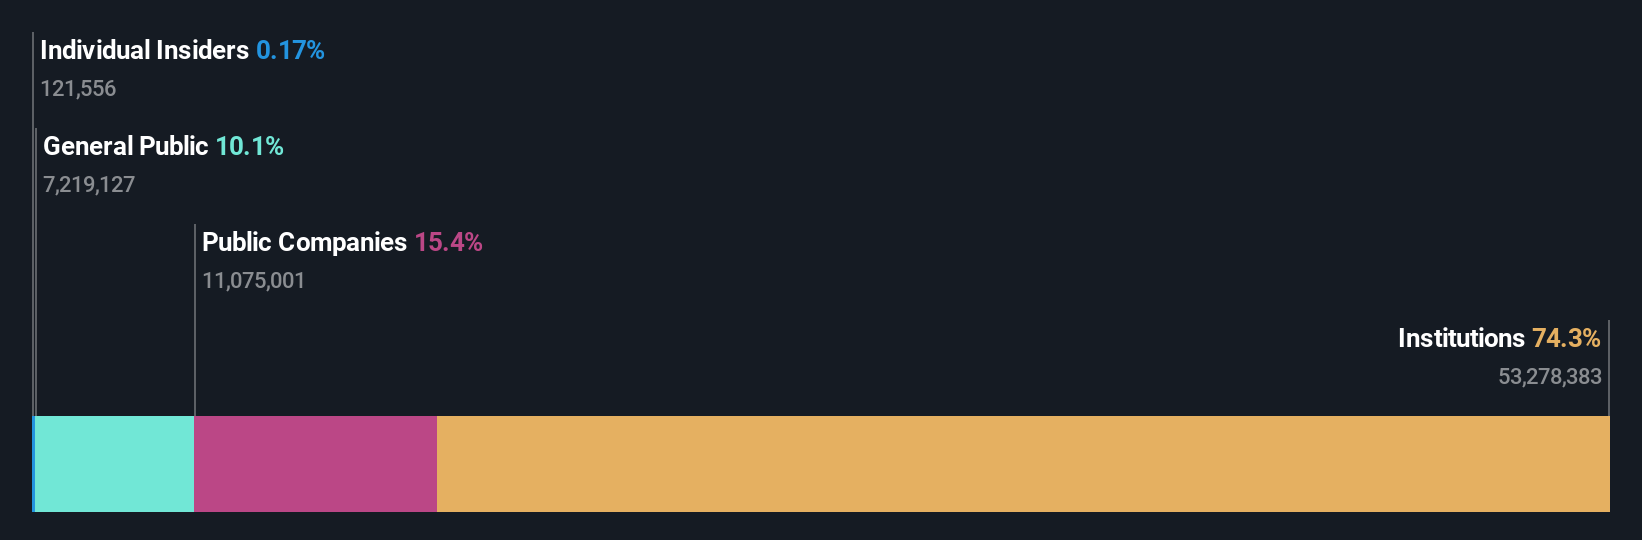
A look at the shareholders of Brookfield Business Corporation (NYSE:BBUC) can tell us which group is most powerful. We can see that institutions own the lion's share in the company with 74% ownership. Put another way, the group faces the maximum upside potential (or downside risk).
Last week’s 6.4% gain means that institutional investors were on the positive end of the spectrum even as the company has shown strong longer-term trends. One-year return to shareholders is currently 56% and last week’s gain was the icing on the cake.
Let's delve deeper into each type of owner of Brookfield Business, beginning with the chart below.
Check out our latest analysis for Brookfield Business
What Does The Institutional Ownership Tell Us About Brookfield Business?
Many institutions measure their performance against an index that approximates the local market. So they usually pay more attention to companies that are included in major indices.
Brookfield Business already has institutions on the share registry. Indeed, they own a respectable stake in the company. This suggests some credibility amongst professional investors. But we can't rely on that fact alone since institutions make bad investments sometimes, just like everyone does. When multiple institutions own a stock, there's always a risk that they are in a 'crowded trade'. When such a trade goes wrong, multiple parties may compete to sell stock fast. This risk is higher in a company without a history of growth. You can see Brookfield Business' historic earnings and revenue below, but keep in mind there's always more to the story.

Investors should note that institutions actually own more than half the company, so they can collectively wield significant power. Hedge funds don't have many shares in Brookfield Business. Looking at our data, we can see that the largest shareholder is Brookfield Corporation with 52% of shares outstanding. This implies that they have majority interest control of the future of the company. With 14% and 8.4% of the shares outstanding respectively, Brookfield Wealth Solutions Ltd. and OMERS Administration Corporation are the second and third largest shareholders.
While studying institutional ownership for a company can add value to your research, it is also a good practice to research analyst recommendations to get a deeper understand of a stock's expected performance. Our information suggests that there isn't any analyst coverage of the stock, so it is probably little known.
Insider Ownership Of Brookfield Business
While the precise definition of an insider can be subjective, almost everyone considers board members to be insiders. Company management run the business, but the CEO will answer to the board, even if he or she is a member of it.
I generally consider insider ownership to be a good thing. However, on some occasions it makes it more difficult for other shareholders to hold the board accountable for decisions.
Our data suggests that insiders own under 1% of Brookfield Business Corporation in their own names. It's a big company, so even a small proportional interest can create alignment between the board and shareholders. In this case insiders own US$3.8m worth of shares. It is always good to see at least some insider ownership, but it might be worth checking if those insiders have been selling.
General Public Ownership
The general public, who are usually individual investors, hold a 10% stake in Brookfield Business. While this size of ownership may not be enough to sway a policy decision in their favour, they can still make a collective impact on company policies.
Public Company Ownership
Public companies currently own 15% of Brookfield Business stock. We can't be certain but it is quite possible this is a strategic stake. The businesses may be similar, or work together.
Next Steps:
I find it very interesting to look at who exactly owns a company. But to truly gain insight, we need to consider other information, too. For example, we've discovered 1 warning sign for Brookfield Business that you should be aware of before investing here.
If you would prefer check out another company -- one with potentially superior financials -- then do not miss this free list of interesting companies, backed by strong financial data.
NB: Figures in this article are calculated using data from the last twelve months, which refer to the 12-month period ending on the last date of the month the financial statement is dated. This may not be consistent with full year annual report figures.
Have feedback on this article? Concerned about the content? Get in touch with us directly. Alternatively, email editorial-team (at) simplywallst.com.
This article by Simply Wall St is general in nature. We provide commentary based on historical data and analyst forecasts only using an unbiased methodology and our articles are not intended to be financial advice. It does not constitute a recommendation to buy or sell any stock, and does not take account of your objectives, or your financial situation. We aim to bring you long-term focused analysis driven by fundamental data. Note that our analysis may not factor in the latest price-sensitive company announcements or qualitative material. Simply Wall St has no position in any stocks mentioned.