
- LIVE QUOTES
- LEARN
- HELP
 Wall Street Journal
EN
Calculating The Fair Value Of Chocoladefabriken Lindt & Sprüngli AG (VTX:LISN)
Key Insights
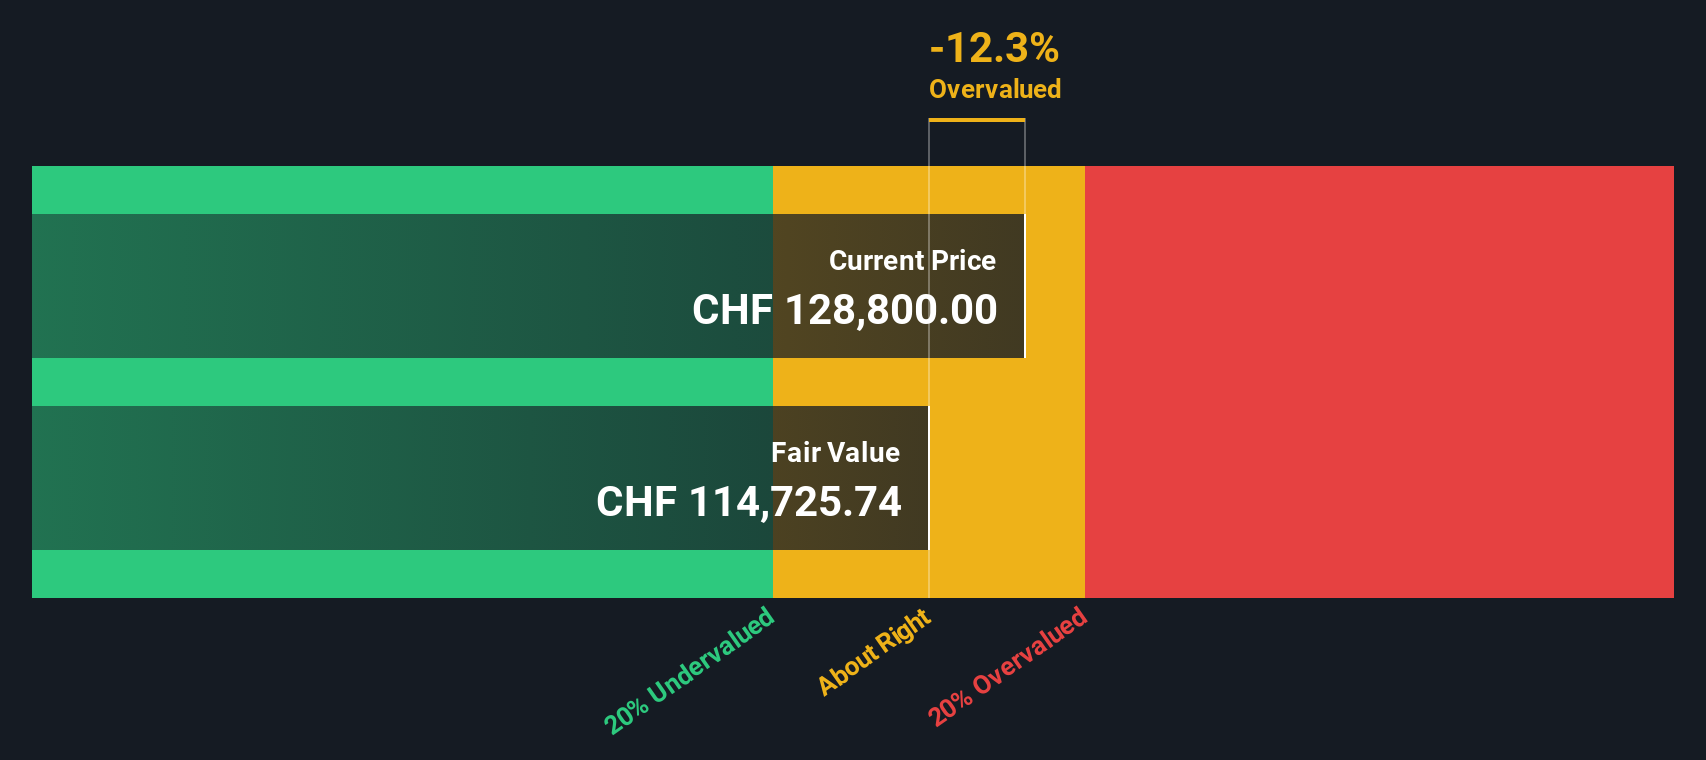
- Using the 2 Stage Free Cash Flow to Equity, Chocoladefabriken Lindt & Sprüngli fair value estimate is CHF114,726
- Current share price of CHF128,800 suggests Chocoladefabriken Lindt & Sprüngli is potentially trading close to its fair value
- Our fair value estimate is similar to Chocoladefabriken Lindt & Sprüngli's analyst price target of CHF115,145
Does the June share price for Chocoladefabriken Lindt & Sprüngli AG (VTX:LISN) reflect what it's really worth? Today, we will estimate the stock's intrinsic value by taking the expected future cash flows and discounting them to their present value. The Discounted Cash Flow (DCF) model is the tool we will apply to do this. Models like these may appear beyond the comprehension of a lay person, but they're fairly easy to follow.
Remember though, that there are many ways to estimate a company's value, and a DCF is just one method. If you still have some burning questions about this type of valuation, take a look at the Simply Wall St analysis model.
The Model
We are going to use a two-stage DCF model, which, as the name states, takes into account two stages of growth. The first stage is generally a higher growth period which levels off heading towards the terminal value, captured in the second 'steady growth' period. To start off with, we need to estimate the next ten years of cash flows. Where possible we use analyst estimates, but when these aren't available we extrapolate the previous free cash flow (FCF) from the last estimate or reported value. We assume companies with shrinking free cash flow will slow their rate of shrinkage, and that companies with growing free cash flow will see their growth rate slow, over this period. We do this to reflect that growth tends to slow more in the early years than it does in later years.
Generally we assume that a dollar today is more valuable than a dollar in the future, and so the sum of these future cash flows is then discounted to today's value:
10-year free cash flow (FCF) forecast
| 2025 | 2026 | 2027 | 2028 | 2029 | 2030 | 2031 | 2032 | 2033 | 2034 | |
| Levered FCF (CHF, Millions) | CHF619.7m | CHF732.8m | CHF764.5m | CHF838.0m | CHF886.0m | CHF918.9m | CHF944.0m | CHF963.2m | CHF978.1m | CHF989.9m |
| Growth Rate Estimate Source | Analyst x9 | Analyst x8 | Analyst x8 | Analyst x1 | Analyst x1 | Est @ 3.71% | Est @ 2.73% | Est @ 2.03% | Est @ 1.55% | Est @ 1.21% |
| Present Value (CHF, Millions) Discounted @ 3.9% | CHF597 | CHF679 | CHF682 | CHF720 | CHF732 | CHF731 | CHF723 | CHF710 | CHF694 | CHF676 |
("Est" = FCF growth rate estimated by Simply Wall St)
Present Value of 10-year Cash Flow (PVCF) = CHF6.9b
We now need to calculate the Terminal Value, which accounts for all the future cash flows after this ten year period. The Gordon Growth formula is used to calculate Terminal Value at a future annual growth rate equal to the 5-year average of the 10-year government bond yield of 0.4%. We discount the terminal cash flows to today's value at a cost of equity of 3.9%.
Terminal Value (TV)= FCF2034 × (1 + g) ÷ (r – g) = CHF990m× (1 + 0.4%) ÷ (3.9%– 0.4%) = CHF29b
Present Value of Terminal Value (PVTV)= TV / (1 + r)10= CHF29b÷ ( 1 + 3.9%)10= CHF20b
The total value, or equity value, is then the sum of the present value of the future cash flows, which in this case is CHF27b. The last step is to then divide the equity value by the number of shares outstanding. Compared to the current share price of CHF129k, the company appears around fair value at the time of writing. Remember though, that this is just an approximate valuation, and like any complex formula - garbage in, garbage out.
The Assumptions
The calculation above is very dependent on two assumptions. The first is the discount rate and the other is the cash flows. Part of investing is coming up with your own evaluation of a company's future performance, so try the calculation yourself and check your own assumptions. The DCF also does not consider the possible cyclicality of an industry, or a company's future capital requirements, so it does not give a full picture of a company's potential performance. Given that we are looking at Chocoladefabriken Lindt & Sprüngli as potential shareholders, the cost of equity is used as the discount rate, rather than the cost of capital (or weighted average cost of capital, WACC) which accounts for debt. In this calculation we've used 3.9%, which is based on a levered beta of 0.800. Beta is a measure of a stock's volatility, compared to the market as a whole. We get our beta from the industry average beta of globally comparable companies, with an imposed limit between 0.8 and 2.0, which is a reasonable range for a stable business.
View our latest analysis for Chocoladefabriken Lindt & Sprüngli
SWOT Analysis for Chocoladefabriken Lindt & Sprüngli
- Earnings growth over the past year exceeded the industry.
- Debt is not viewed as a risk.
- Dividends are covered by earnings and cash flows.
- Earnings growth over the past year is below its 5-year average.
- Dividend is low compared to the top 25% of dividend payers in the Food market.
- Expensive based on P/E ratio and estimated fair value.
- Annual revenue is forecast to grow faster than the Swiss market.
- Annual earnings are forecast to grow slower than the Swiss market.
Looking Ahead:
Although the valuation of a company is important, it is only one of many factors that you need to assess for a company. It's not possible to obtain a foolproof valuation with a DCF model. Instead the best use for a DCF model is to test certain assumptions and theories to see if they would lead to the company being undervalued or overvalued. For example, changes in the company's cost of equity or the risk free rate can significantly impact the valuation. For Chocoladefabriken Lindt & Sprüngli, we've put together three essential items you should further research:
- Financial Health: Does LISN have a healthy balance sheet? Take a look at our free balance sheet analysis with six simple checks on key factors like leverage and risk.
- Future Earnings: How does LISN's growth rate compare to its peers and the wider market? Dig deeper into the analyst consensus number for the upcoming years by interacting with our free analyst growth expectation chart.
- Other Solid Businesses: Low debt, high returns on equity and good past performance are fundamental to a strong business. Why not explore our interactive list of stocks with solid business fundamentals to see if there are other companies you may not have considered!
PS. The Simply Wall St app conducts a discounted cash flow valuation for every stock on the SWX every day. If you want to find the calculation for other stocks just search here.
Have feedback on this article? Concerned about the content? Get in touch with us directly. Alternatively, email editorial-team (at) simplywallst.com.
This article by Simply Wall St is general in nature. We provide commentary based on historical data and analyst forecasts only using an unbiased methodology and our articles are not intended to be financial advice. It does not constitute a recommendation to buy or sell any stock, and does not take account of your objectives, or your financial situation. We aim to bring you long-term focused analysis driven by fundamental data. Note that our analysis may not factor in the latest price-sensitive company announcements or qualitative material. Simply Wall St has no position in any stocks mentioned.