
- LIVE QUOTES
- LEARN
- HELP
 Wall Street Journal
EN
M/I Homes (NYSE:MHO) jumps 5.9% this week, though earnings growth is still tracking behind five-year shareholder returns
The most you can lose on any stock (assuming you don't use leverage) is 100% of your money. But on the bright side, if you buy shares in a high quality company at the right price, you can gain well over 100%. One great example is M/I Homes, Inc. (NYSE:MHO) which saw its share price drive 220% higher over five years. And in the last week the share price has popped 5.9%.
Since the stock has added US$166m to its market cap in the past week alone, let's see if underlying performance has been driving long-term returns.
While the efficient markets hypothesis continues to be taught by some, it has been proven that markets are over-reactive dynamic systems, and investors are not always rational. By comparing earnings per share (EPS) and share price changes over time, we can get a feel for how investor attitudes to a company have morphed over time.
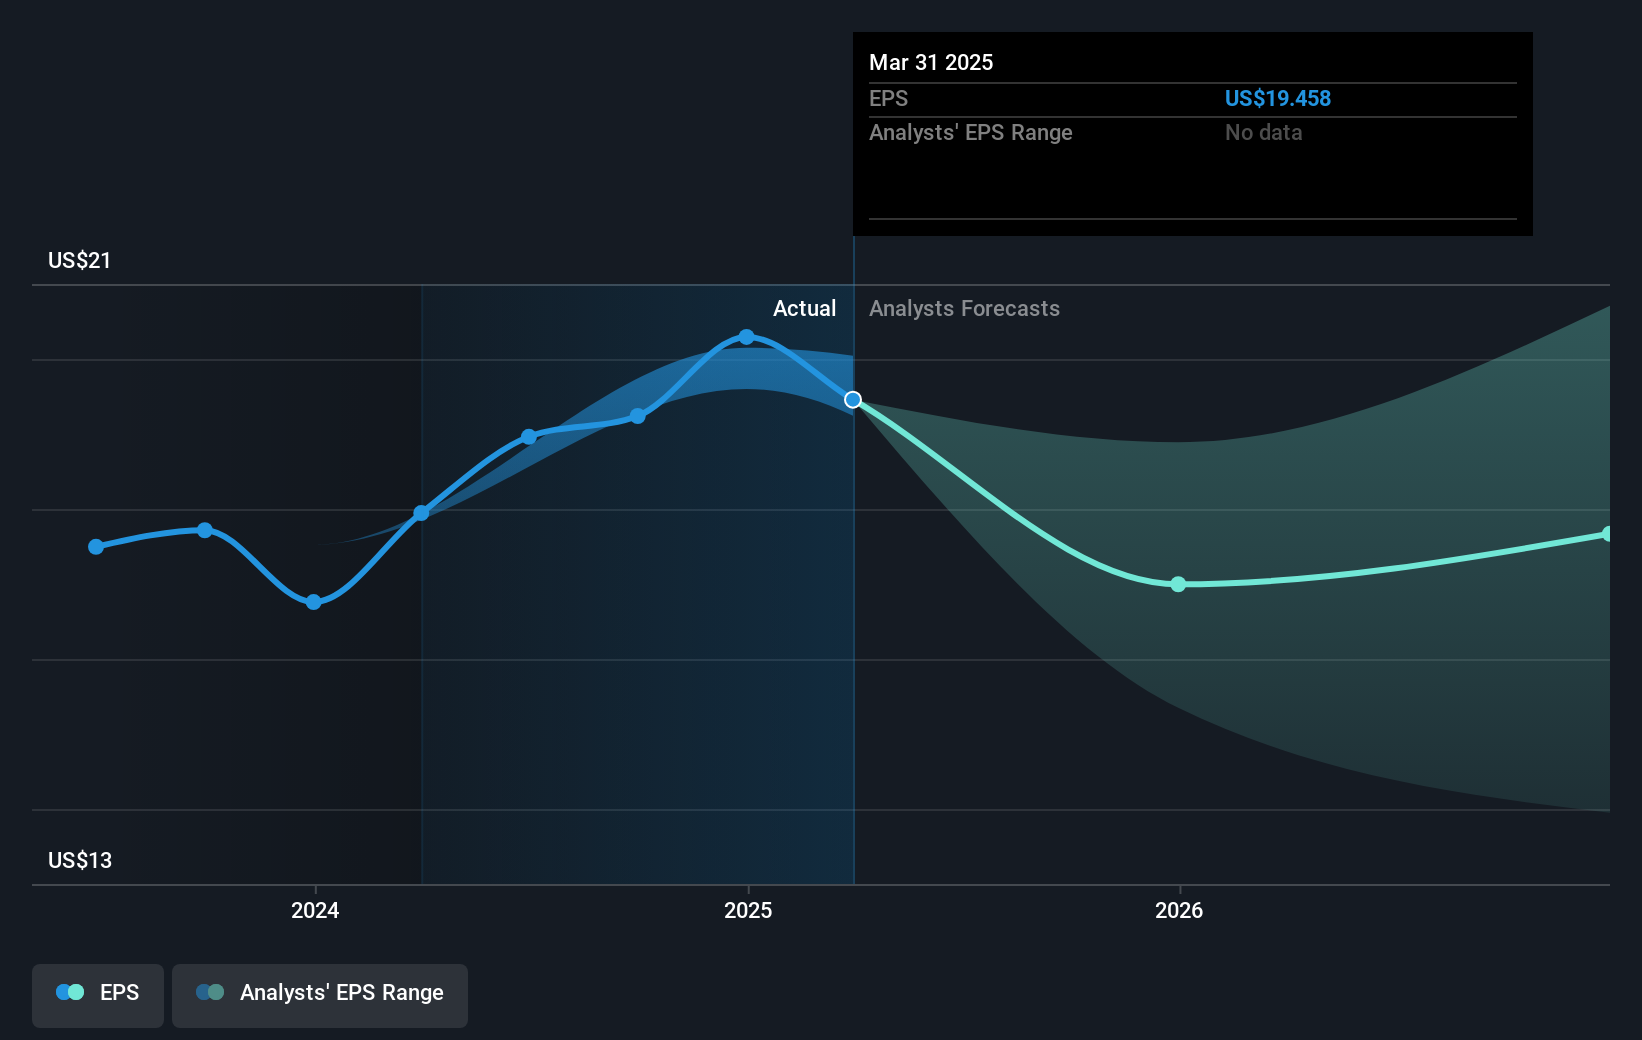
During five years of share price growth, M/I Homes achieved compound earnings per share (EPS) growth of 32% per year. This EPS growth is higher than the 26% average annual increase in the share price. So one could conclude that the broader market has become more cautious towards the stock. The reasonably low P/E ratio of 5.51 also suggests market apprehension.
You can see how EPS has changed over time in the image below (click on the chart to see the exact values).
This free interactive report on M/I Homes' earnings, revenue and cash flow is a great place to start, if you want to investigate the stock further.
A Different Perspective
While the broader market gained around 12% in the last year, M/I Homes shareholders lost 8.1%. However, keep in mind that even the best stocks will sometimes underperform the market over a twelve month period. On the bright side, long term shareholders have made money, with a gain of 26% per year over half a decade. It could be that the recent sell-off is an opportunity, so it may be worth checking the fundamental data for signs of a long term growth trend. It's always interesting to track share price performance over the longer term. But to understand M/I Homes better, we need to consider many other factors. For example, we've discovered 1 warning sign for M/I Homes that you should be aware of before investing here.
If you like to buy stocks alongside management, then you might just love this free list of companies. (Hint: many of them are unnoticed AND have attractive valuation).
Please note, the market returns quoted in this article reflect the market weighted average returns of stocks that currently trade on American exchanges.
Have feedback on this article? Concerned about the content? Get in touch with us directly. Alternatively, email editorial-team (at) simplywallst.com.
This article by Simply Wall St is general in nature. We provide commentary based on historical data and analyst forecasts only using an unbiased methodology and our articles are not intended to be financial advice. It does not constitute a recommendation to buy or sell any stock, and does not take account of your objectives, or your financial situation. We aim to bring you long-term focused analysis driven by fundamental data. Note that our analysis may not factor in the latest price-sensitive company announcements or qualitative material. Simply Wall St has no position in any stocks mentioned.