
- LIVE QUOTES
- LEARN
- HELP
 Wall Street Journal
EN
S&T Bancorp, Inc.'s (NASDAQ:STBA) institutional investors lost 3.7% last week but have benefitted from longer-term gains
Key Insights
- Institutions' substantial holdings in S&T Bancorp implies that they have significant influence over the company's share price
- The top 11 shareholders own 51% of the company
- Recent purchases by insiders
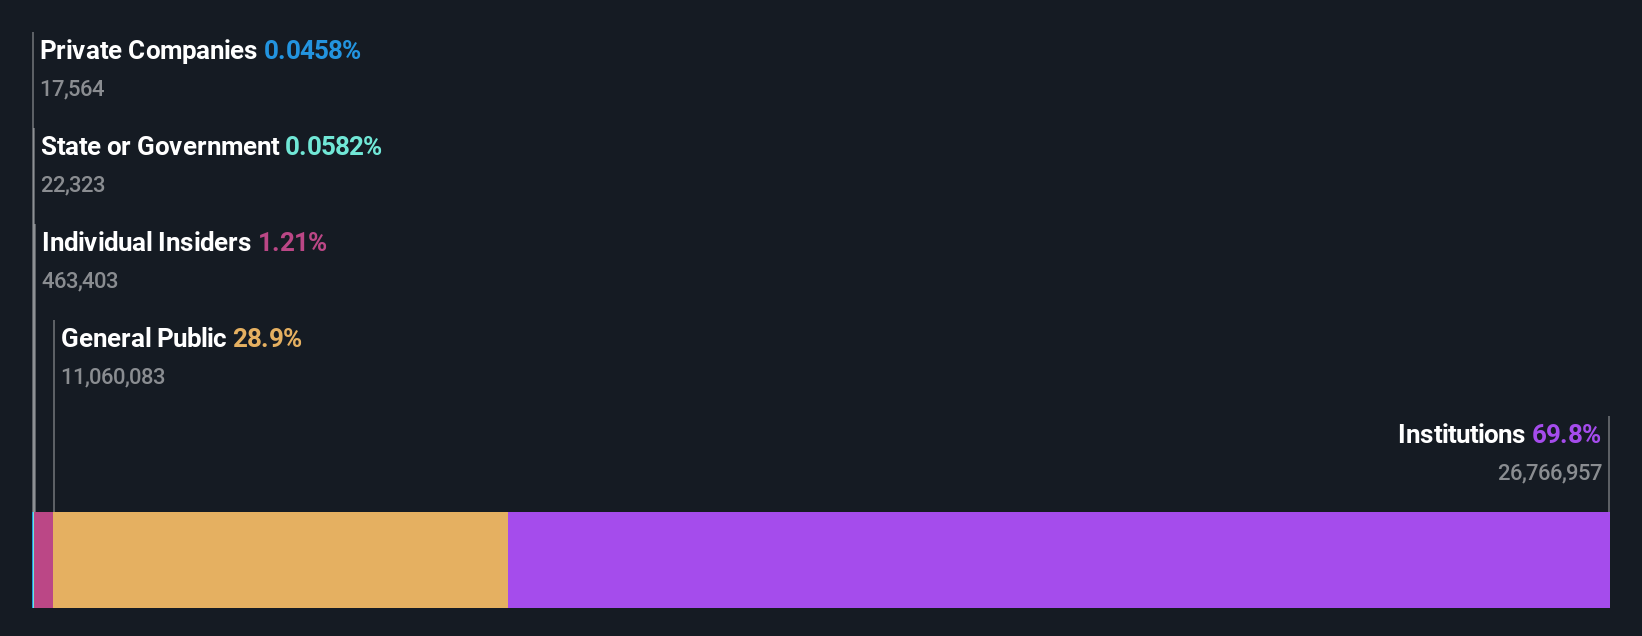
If you want to know who really controls S&T Bancorp, Inc. (NASDAQ:STBA), then you'll have to look at the makeup of its share registry. The group holding the most number of shares in the company, around 70% to be precise, is institutions. In other words, the group stands to gain the most (or lose the most) from their investment into the company.
No shareholder likes losing money on their investments, especially institutional investors who saw their holdings drop 3.7% in value last week. However, the 20% one-year returns may have helped alleviate their overall losses. We would assume however, that they would be on the lookout for weakness in the future.
Let's delve deeper into each type of owner of S&T Bancorp, beginning with the chart below.
View our latest analysis for S&T Bancorp
What Does The Institutional Ownership Tell Us About S&T Bancorp?
Institutions typically measure themselves against a benchmark when reporting to their own investors, so they often become more enthusiastic about a stock once it's included in a major index. We would expect most companies to have some institutions on the register, especially if they are growing.
As you can see, institutional investors have a fair amount of stake in S&T Bancorp. This can indicate that the company has a certain degree of credibility in the investment community. However, it is best to be wary of relying on the supposed validation that comes with institutional investors. They too, get it wrong sometimes. It is not uncommon to see a big share price drop if two large institutional investors try to sell out of a stock at the same time. So it is worth checking the past earnings trajectory of S&T Bancorp, (below). Of course, keep in mind that there are other factors to consider, too.
Investors should note that institutions actually own more than half the company, so they can collectively wield significant power. Hedge funds don't have many shares in S&T Bancorp. BlackRock, Inc. is currently the company's largest shareholder with 14% of shares outstanding. With 12% and 6.2% of the shares outstanding respectively, The Vanguard Group, Inc. and Dimensional Fund Advisors LP are the second and third largest shareholders.
Looking at the shareholder registry, we can see that 51% of the ownership is controlled by the top 11 shareholders, meaning that no single shareholder has a majority interest in the ownership.
While studying institutional ownership for a company can add value to your research, it is also a good practice to research analyst recommendations to get a deeper understand of a stock's expected performance. There are a reasonable number of analysts covering the stock, so it might be useful to find out their aggregate view on the future.
Insider Ownership Of S&T Bancorp
The definition of an insider can differ slightly between different countries, but members of the board of directors always count. Management ultimately answers to the board. However, it is not uncommon for managers to be executive board members, especially if they are a founder or the CEO.
Insider ownership is positive when it signals leadership are thinking like the true owners of the company. However, high insider ownership can also give immense power to a small group within the company. This can be negative in some circumstances.
We can see that insiders own shares in S&T Bancorp, Inc.. This is a big company, so it is good to see this level of alignment. Insiders own US$17m worth of shares (at current prices). Most would say this shows alignment of interests between shareholders and the board. Still, it might be worth checking if those insiders have been selling.
General Public Ownership
With a 29% ownership, the general public, mostly comprising of individual investors, have some degree of sway over S&T Bancorp. While this size of ownership may not be enough to sway a policy decision in their favour, they can still make a collective impact on company policies.
Next Steps:
I find it very interesting to look at who exactly owns a company. But to truly gain insight, we need to consider other information, too. To that end, you should be aware of the 1 warning sign we've spotted with S&T Bancorp .
If you would prefer discover what analysts are predicting in terms of future growth, do not miss this free report on analyst forecasts.
NB: Figures in this article are calculated using data from the last twelve months, which refer to the 12-month period ending on the last date of the month the financial statement is dated. This may not be consistent with full year annual report figures.
Have feedback on this article? Concerned about the content? Get in touch with us directly. Alternatively, email editorial-team (at) simplywallst.com.
This article by Simply Wall St is general in nature. We provide commentary based on historical data and analyst forecasts only using an unbiased methodology and our articles are not intended to be financial advice. It does not constitute a recommendation to buy or sell any stock, and does not take account of your objectives, or your financial situation. We aim to bring you long-term focused analysis driven by fundamental data. Note that our analysis may not factor in the latest price-sensitive company announcements or qualitative material. Simply Wall St has no position in any stocks mentioned.