
- LIVE QUOTES
- LEARN
- HELP
 Wall Street Journal
EN
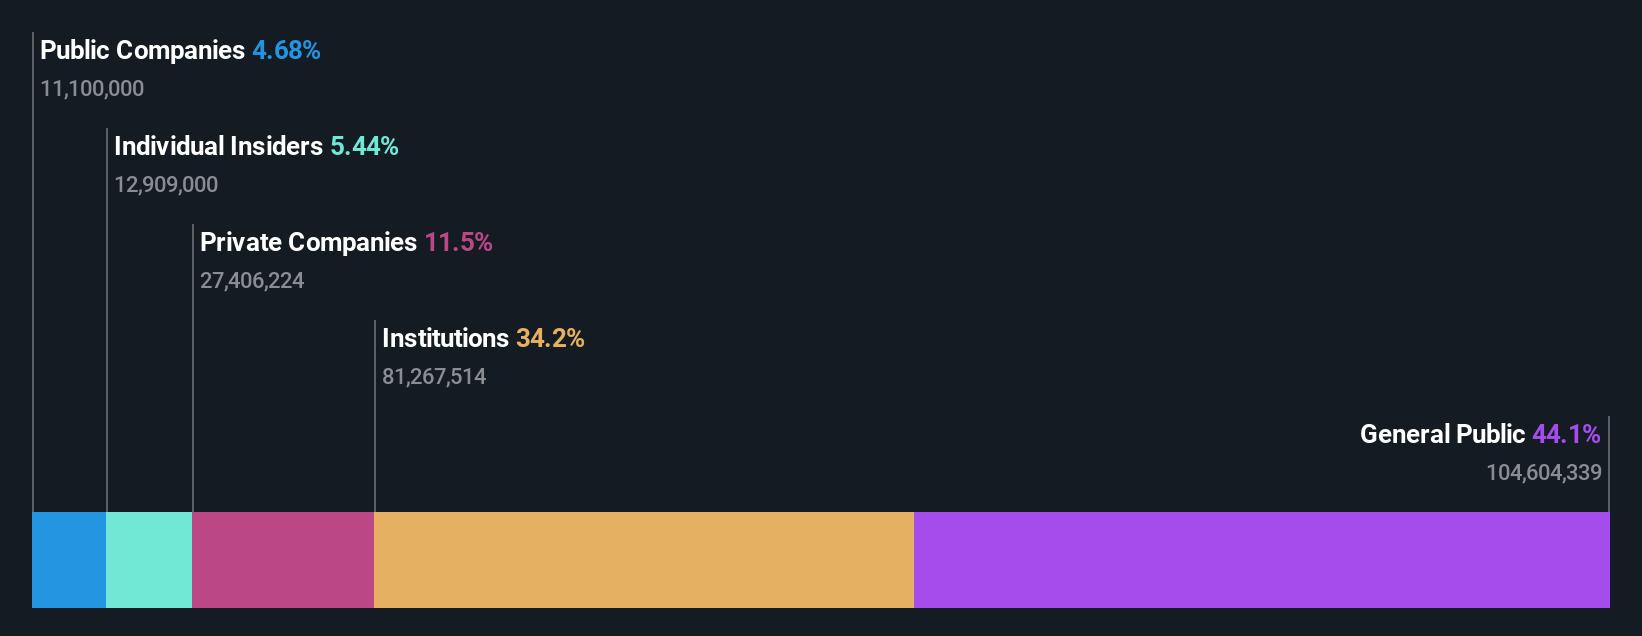
While institutions own 34% of Sanrio Company, Ltd. (TSE:8136), individual investors are its largest shareholders with 44% ownership
Key Insights
- Significant control over Sanrio Company by individual investors implies that the general public has more power to influence management and governance-related decisions
- The top 21 shareholders own 51% of the company
- Institutions own 34% of Sanrio Company
A look at the shareholders of Sanrio Company, Ltd. (TSE:8136) can tell us which group is most powerful. With 44% stake, individual investors possess the maximum shares in the company. That is, the group stands to benefit the most if the stock rises (or lose the most if there is a downturn).
Meanwhile, institutions make up 34% of the company’s shareholders. Large companies usually have institutions as shareholders, and we usually see insiders owning shares in smaller companies.
In the chart below, we zoom in on the different ownership groups of Sanrio Company.
Check out our latest analysis for Sanrio Company
What Does The Institutional Ownership Tell Us About Sanrio Company?
Institutions typically measure themselves against a benchmark when reporting to their own investors, so they often become more enthusiastic about a stock once it's included in a major index. We would expect most companies to have some institutions on the register, especially if they are growing.
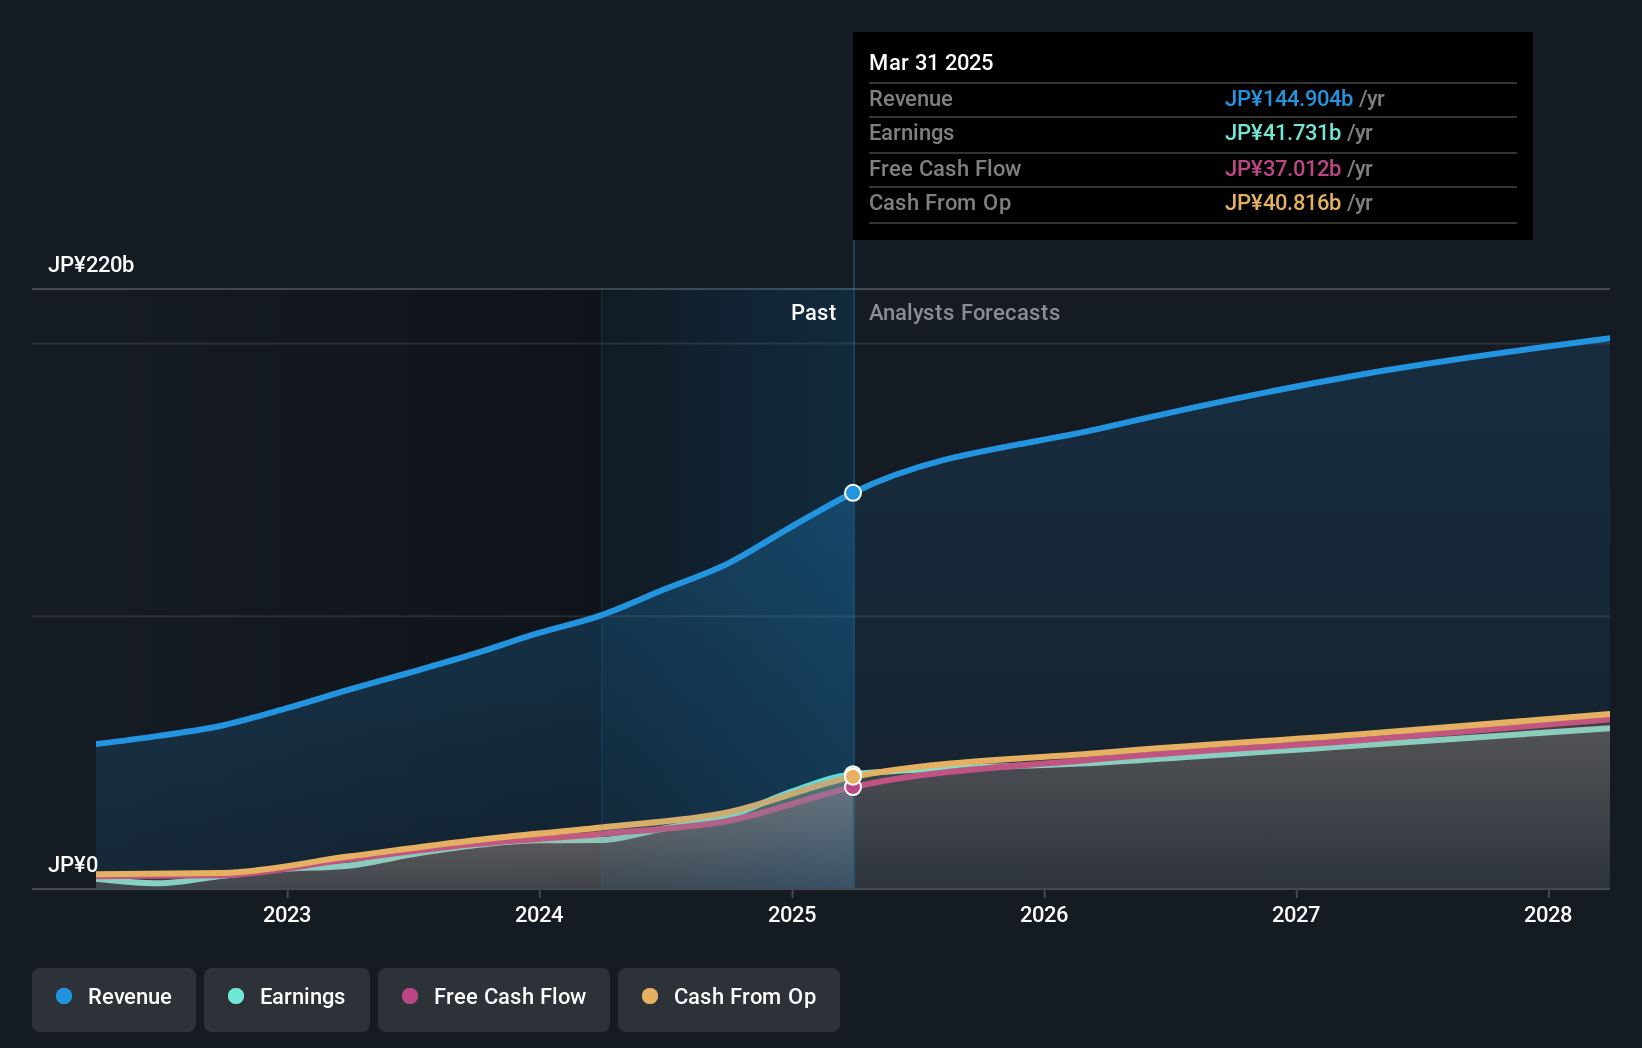
Sanrio Company already has institutions on the share registry. Indeed, they own a respectable stake in the company. This can indicate that the company has a certain degree of credibility in the investment community. However, it is best to be wary of relying on the supposed validation that comes with institutional investors. They too, get it wrong sometimes. It is not uncommon to see a big share price drop if two large institutional investors try to sell out of a stock at the same time. So it is worth checking the past earnings trajectory of Sanrio Company, (below). Of course, keep in mind that there are other factors to consider, too.
Sanrio Company is not owned by hedge funds. Kiyokawa Shoji Kk is currently the largest shareholder, with 8.3% of shares outstanding. Meanwhile, the second and third largest shareholders, hold 5.4% and 4.7%, of the shares outstanding, respectively.
Looking at the shareholder registry, we can see that 51% of the ownership is controlled by the top 21 shareholders, meaning that no single shareholder has a majority interest in the ownership.
Researching institutional ownership is a good way to gauge and filter a stock's expected performance. The same can be achieved by studying analyst sentiments. Quite a few analysts cover the stock, so you could look into forecast growth quite easily.
Insider Ownership Of Sanrio Company
The definition of company insiders can be subjective and does vary between jurisdictions. Our data reflects individual insiders, capturing board members at the very least. Management ultimately answers to the board. However, it is not uncommon for managers to be executive board members, especially if they are a founder or the CEO.
Insider ownership is positive when it signals leadership are thinking like the true owners of the company. However, high insider ownership can also give immense power to a small group within the company. This can be negative in some circumstances.
We can see that insiders own shares in Sanrio Company, Ltd.. The insiders have a meaningful stake worth JP¥87b. It is good to see this level of investment. You can check here to see if those insiders have been buying recently.
General Public Ownership
With a 44% ownership, the general public, mostly comprising of individual investors, have some degree of sway over Sanrio Company. While this group can't necessarily call the shots, it can certainly have a real influence on how the company is run.
Private Company Ownership
Our data indicates that Private Companies hold 12%, of the company's shares. It might be worth looking deeper into this. If related parties, such as insiders, have an interest in one of these private companies, that should be disclosed in the annual report. Private companies may also have a strategic interest in the company.
Public Company Ownership
We can see that public companies hold 4.7% of the Sanrio Company shares on issue. We can't be certain but it is quite possible this is a strategic stake. The businesses may be similar, or work together.
Next Steps:
I find it very interesting to look at who exactly owns a company. But to truly gain insight, we need to consider other information, too. Be aware that Sanrio Company is showing 1 warning sign in our investment analysis , you should know about...
If you would prefer discover what analysts are predicting in terms of future growth, do not miss this free report on analyst forecasts.
NB: Figures in this article are calculated using data from the last twelve months, which refer to the 12-month period ending on the last date of the month the financial statement is dated. This may not be consistent with full year annual report figures.
Have feedback on this article? Concerned about the content? Get in touch with us directly. Alternatively, email editorial-team (at) simplywallst.com.
This article by Simply Wall St is general in nature. We provide commentary based on historical data and analyst forecasts only using an unbiased methodology and our articles are not intended to be financial advice. It does not constitute a recommendation to buy or sell any stock, and does not take account of your objectives, or your financial situation. We aim to bring you long-term focused analysis driven by fundamental data. Note that our analysis may not factor in the latest price-sensitive company announcements or qualitative material. Simply Wall St has no position in any stocks mentioned.