
- LIVE QUOTES
- LEARN
- HELP
 Wall Street Journal
EN
Do Its Financials Have Any Role To Play In Driving The Mosaic Company's (NYSE:MOS) Stock Up Recently?
Mosaic (NYSE:MOS) has had a great run on the share market with its stock up by a significant 31% over the last three months. Given that stock prices are usually aligned with a company's financial performance in the long-term, we decided to study its financial indicators more closely to see if they had a hand to play in the recent price move. In this article, we decided to focus on Mosaic's ROE.
Return on Equity or ROE is a test of how effectively a company is growing its value and managing investors’ money. In other words, it is a profitability ratio which measures the rate of return on the capital provided by the company's shareholders.
How Do You Calculate Return On Equity?
ROE can be calculated by using the formula:
Return on Equity = Net Profit (from continuing operations) ÷ Shareholders' Equity
So, based on the above formula, the ROE for Mosaic is:
3.3% = US$396m ÷ US$12b (Based on the trailing twelve months to March 2025).
The 'return' refers to a company's earnings over the last year. That means that for every $1 worth of shareholders' equity, the company generated $0.03 in profit.
View our latest analysis for Mosaic
What Has ROE Got To Do With Earnings Growth?
We have already established that ROE serves as an efficient profit-generating gauge for a company's future earnings. We now need to evaluate how much profit the company reinvests or "retains" for future growth which then gives us an idea about the growth potential of the company. Generally speaking, other things being equal, firms with a high return on equity and profit retention, have a higher growth rate than firms that don’t share these attributes.
A Side By Side comparison of Mosaic's Earnings Growth And 3.3% ROE
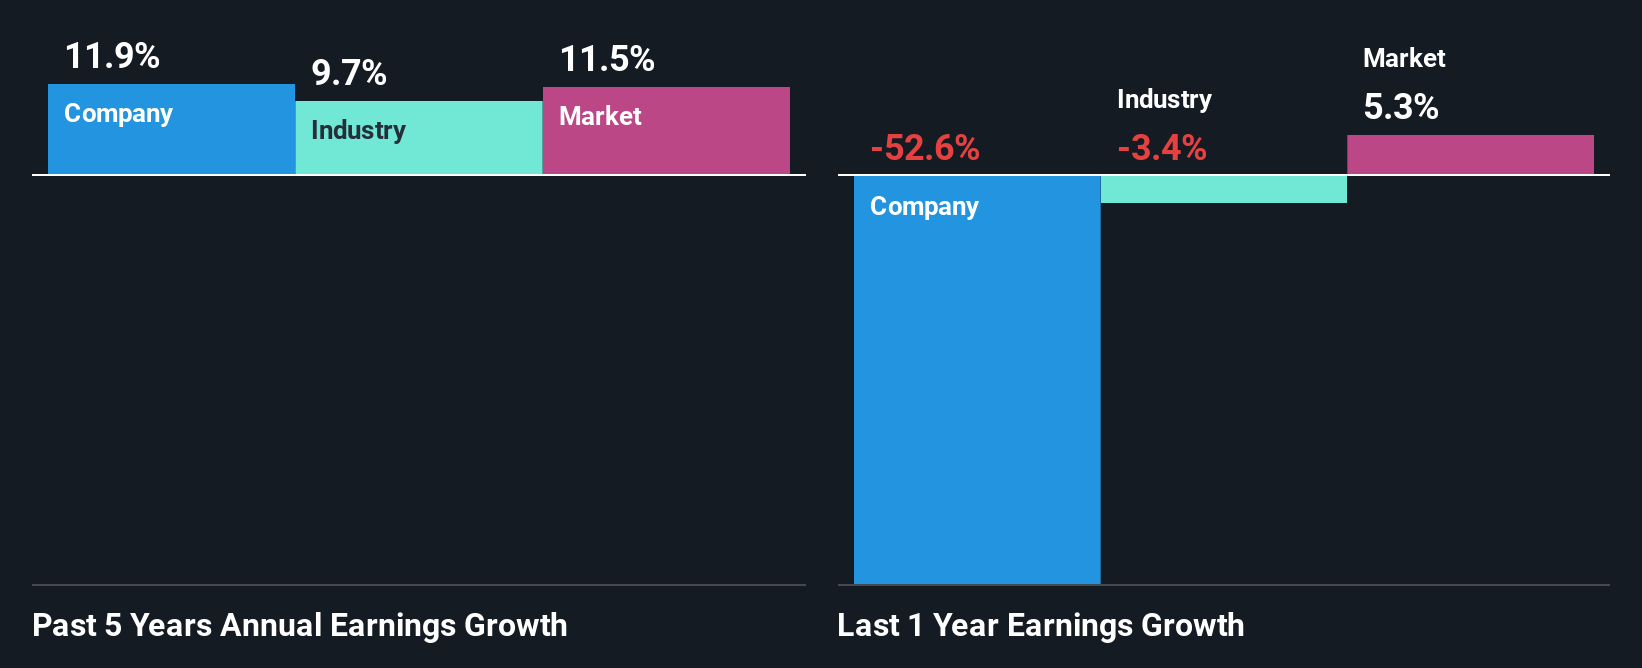
It is hard to argue that Mosaic's ROE is much good in and of itself. Even compared to the average industry ROE of 11%, the company's ROE is quite dismal. Although, we can see that Mosaic saw a modest net income growth of 12% over the past five years. We reckon that there could be other factors at play here. For example, it is possible that the company's management has made some good strategic decisions, or that the company has a low payout ratio.
We then compared Mosaic's net income growth with the industry and we're pleased to see that the company's growth figure is higher when compared with the industry which has a growth rate of 9.7% in the same 5-year period.
Earnings growth is a huge factor in stock valuation. It’s important for an investor to know whether the market has priced in the company's expected earnings growth (or decline). This then helps them determine if the stock is placed for a bright or bleak future. Has the market priced in the future outlook for MOS? You can find out in our latest intrinsic value infographic research report.
Is Mosaic Efficiently Re-investing Its Profits?
Mosaic's three-year median payout ratio to shareholders is 20% (implying that it retains 80% of its income), which is on the lower side, so it seems like the management is reinvesting profits heavily to grow its business.
Moreover, Mosaic is determined to keep sharing its profits with shareholders which we infer from its long history of paying a dividend for at least ten years. Upon studying the latest analysts' consensus data, we found that the company's future payout ratio is expected to rise to 35% over the next three years. Still, forecasts suggest that Mosaic's future ROE will rise to 5.2% even though the the company's payout ratio is expected to rise. We presume that there could some other characteristics of the business that could be driving the anticipated growth in the company's ROE.
Summary
On the whole, we do feel that Mosaic has some positive attributes. Even in spite of the low rate of return, the company has posted impressive earnings growth as a result of reinvesting heavily into its business. We also studied the latest analyst forecasts and found that the company's earnings growth is expected be similar to its current growth rate. To know more about the company's future earnings growth forecasts take a look at this free report on analyst forecasts for the company to find out more.
Have feedback on this article? Concerned about the content? Get in touch with us directly. Alternatively, email editorial-team (at) simplywallst.com.
This article by Simply Wall St is general in nature. We provide commentary based on historical data and analyst forecasts only using an unbiased methodology and our articles are not intended to be financial advice. It does not constitute a recommendation to buy or sell any stock, and does not take account of your objectives, or your financial situation. We aim to bring you long-term focused analysis driven by fundamental data. Note that our analysis may not factor in the latest price-sensitive company announcements or qualitative material. Simply Wall St has no position in any stocks mentioned.