
- LIVE QUOTES
- LEARN
- HELP
 Wall Street Journal
EN
Forecasting The Future: 9 Analyst Projections For Sherwin-Williams
In the last three months, 9 analysts have published ratings on Sherwin-Williams (NYSE:SHW), offering a diverse range of perspectives from bullish to bearish.
The table below provides a concise overview of recent ratings by analysts, offering insights into the changing sentiments over the past 30 days and drawing comparisons with the preceding months for a holistic perspective.
| Bullish | Somewhat Bullish | Indifferent | Somewhat Bearish | Bearish | |
|---|---|---|---|---|---|
| Total Ratings | 2 | 3 | 4 | 0 | 0 |
| Last 30D | 0 | 0 | 1 | 0 | 0 |
| 1M Ago | 0 | 0 | 0 | 0 | 0 |
| 2M Ago | 0 | 3 | 0 | 0 | 0 |
| 3M Ago | 2 | 0 | 3 | 0 | 0 |
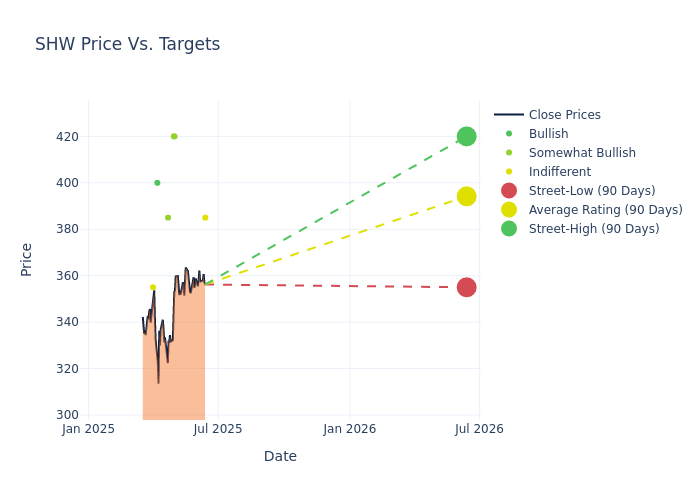
The 12-month price targets assessed by analysts reveal further insights, featuring an average target of $385.56, a high estimate of $420.00, and a low estimate of $350.00. Experiencing a 3.29% decline, the current average is now lower than the previous average price target of $398.67.
Analyzing Analyst Ratings: A Detailed Breakdown
The standing of Sherwin-Williams among financial experts becomes clear with a thorough analysis of recent analyst actions. The summary below outlines key analysts, their recent evaluations, and adjustments to ratings and price targets.
| Analyst | Analyst Firm | Action Taken | Rating | Current Price Target | Prior Price Target |
|---|---|---|---|---|---|
| Patrick Cunningham | Citigroup | Lowers | Neutral | $385.00 | $405.00 |
| Arun Viswanathan | RBC Capital | Raises | Outperform | $420.00 | $410.00 |
| Michael Sison | Wells Fargo | Raises | Overweight | $420.00 | $350.00 |
| Vincent Andrews | Morgan Stanley | Lowers | Overweight | $385.00 | $405.00 |
| Michael Sison | Wells Fargo | Lowers | Equal-Weight | $350.00 | $380.00 |
| Patrick Cunningham | Citigroup | Lowers | Buy | $375.00 | $423.00 |
| Joshua Spector | UBS | Lowers | Buy | $400.00 | $430.00 |
| Michael Sison | Wells Fargo | Lowers | Equal-Weight | $380.00 | $400.00 |
| Michael Leithead | Barclays | Lowers | Equal-Weight | $355.00 | $385.00 |
Key Insights:
- Action Taken: Responding to changing market dynamics and company performance, analysts update their recommendations. Whether they 'Maintain', 'Raise', or 'Lower' their stance, it signifies their response to recent developments related to Sherwin-Williams. This offers insight into analysts' perspectives on the current state of the company.
- Rating: Offering a comprehensive view, analysts assess stocks qualitatively, spanning from 'Outperform' to 'Underperform'. These ratings convey expectations for the relative performance of Sherwin-Williams compared to the broader market.
- Price Targets: Gaining insights, analysts provide estimates for the future value of Sherwin-Williams's stock. This comparison reveals trends in analysts' expectations over time.
Considering these analyst evaluations in conjunction with other financial indicators can offer a comprehensive understanding of Sherwin-Williams's market position. Stay informed and make well-informed decisions with our Ratings Table.
Stay up to date on Sherwin-Williams analyst ratings.
Get to Know Sherwin-Williams Better
Sherwin-Williams is the largest provider of architectural paint in the United States. The company has over 5,000 stores and sells premium paint at higher price points than most competitors. Sherwin-Williams also sells paint-related products in big-box stores and provides coatings for original equipment manufacturers.
Breaking Down Sherwin-Williams's Financial Performance
Market Capitalization: Boasting an elevated market capitalization, the company surpasses industry averages. This signals substantial size and strong market recognition.
Decline in Revenue: Over the 3M period, Sherwin-Williams faced challenges, resulting in a decline of approximately -1.15% in revenue growth as of 31 March, 2025. This signifies a reduction in the company's top-line earnings. When compared to others in the Materials sector, the company excelled with a growth rate higher than the average among peers.
Net Margin: Sherwin-Williams's net margin is impressive, surpassing industry averages. With a net margin of 9.5%, the company demonstrates strong profitability and effective cost management.
Return on Equity (ROE): Sherwin-Williams's ROE excels beyond industry benchmarks, reaching 12.32%. This signifies robust financial management and efficient use of shareholder equity capital.
Return on Assets (ROA): Sherwin-Williams's financial strength is reflected in its exceptional ROA, which exceeds industry averages. With a remarkable ROA of 2.09%, the company showcases efficient use of assets and strong financial health.
Debt Management: The company faces challenges in debt management with a debt-to-equity ratio higher than the industry average. With a ratio of 3.1, caution is advised due to increased financial risk.
Understanding the Relevance of Analyst Ratings
Within the domain of banking and financial systems, analysts specialize in reporting for specific stocks or defined sectors. Their work involves attending company conference calls and meetings, researching company financial statements, and communicating with insiders to publish "analyst ratings" for stocks. Analysts typically assess and rate each stock once per quarter.
Some analysts publish their predictions for metrics such as growth estimates, earnings, and revenue to provide additional guidance with their ratings. When using analyst ratings, it is important to keep in mind that stock and sector analysts are also human and are only offering their opinions to investors.
Which Stocks Are Analysts Recommending Now?
Benzinga Edge gives you instant access to all major analyst upgrades, downgrades, and price targets. Sort by accuracy, upside potential, and more. Click here to stay ahead of the market.
This article was generated by Benzinga's automated content engine and reviewed by an editor.